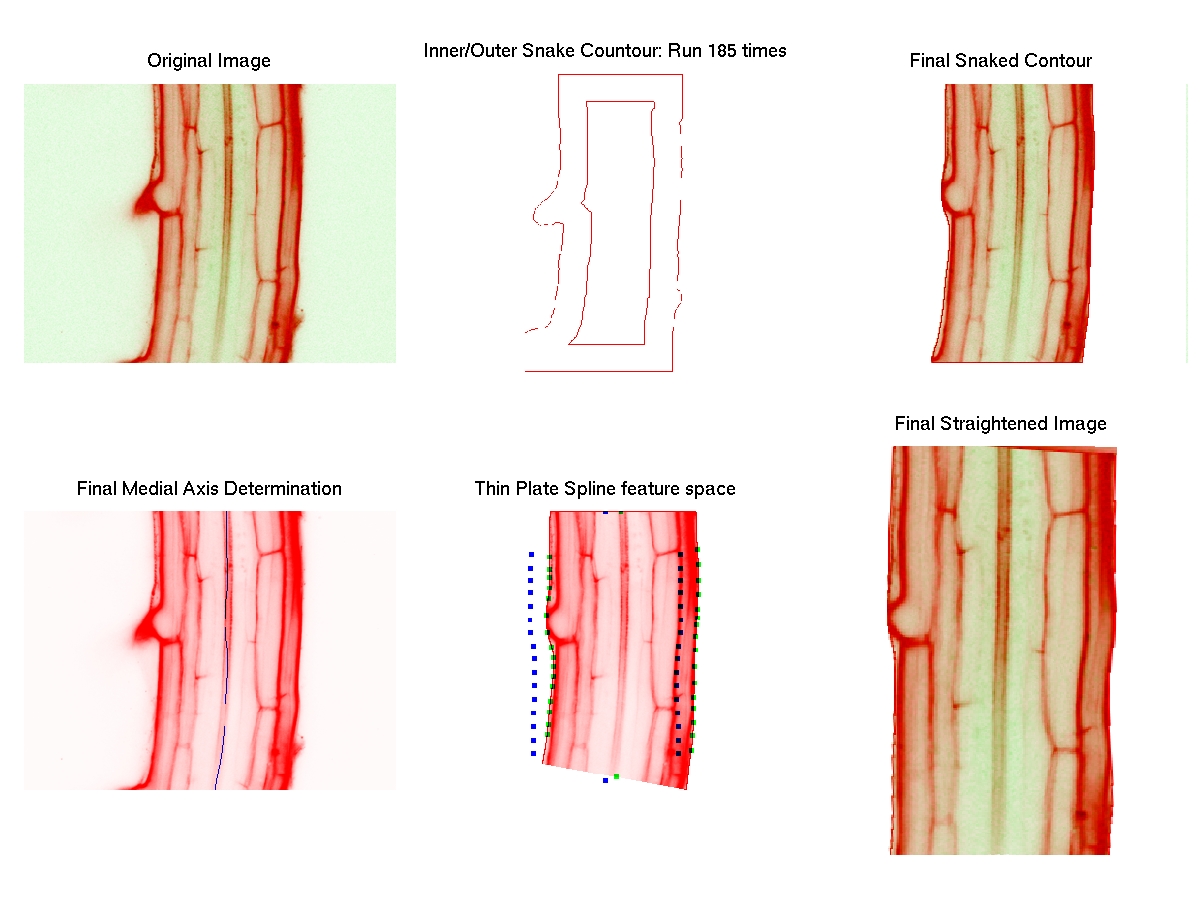
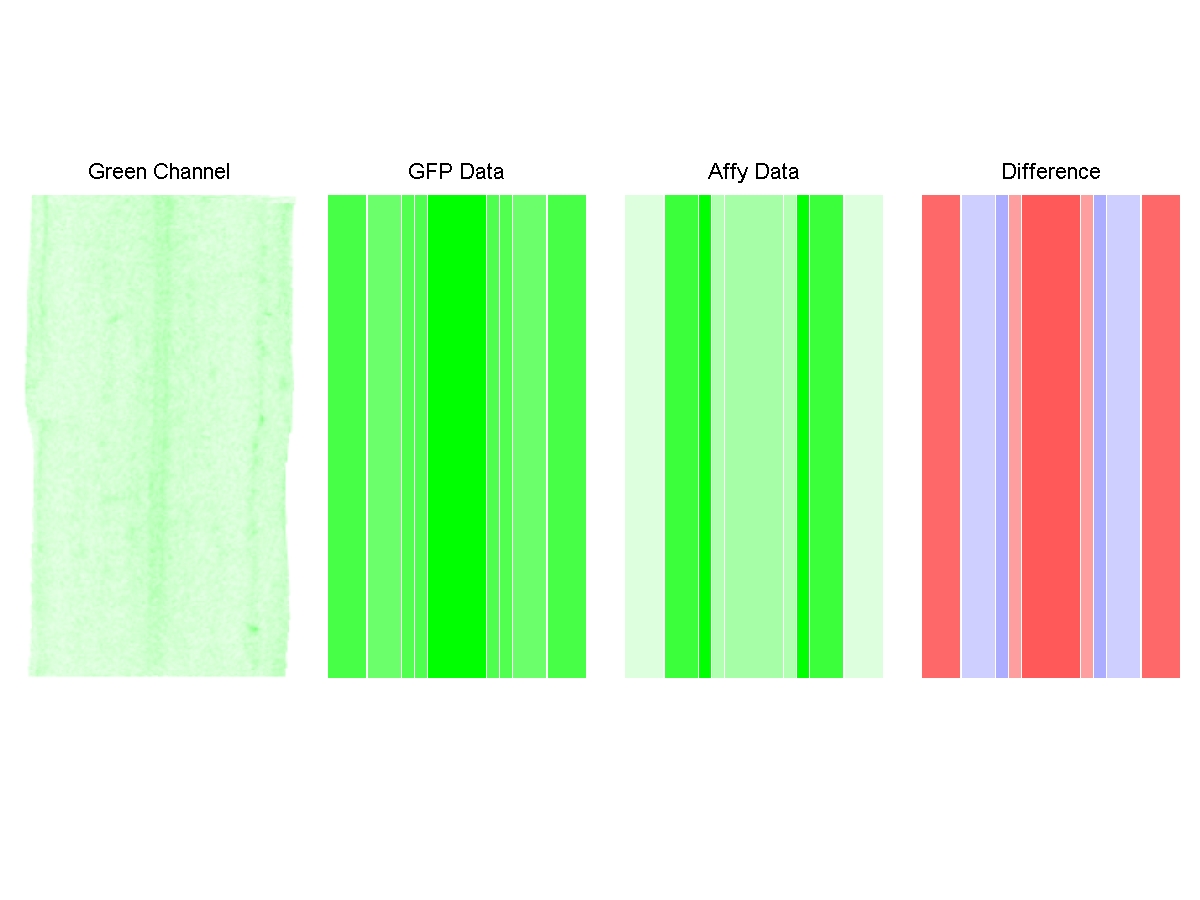
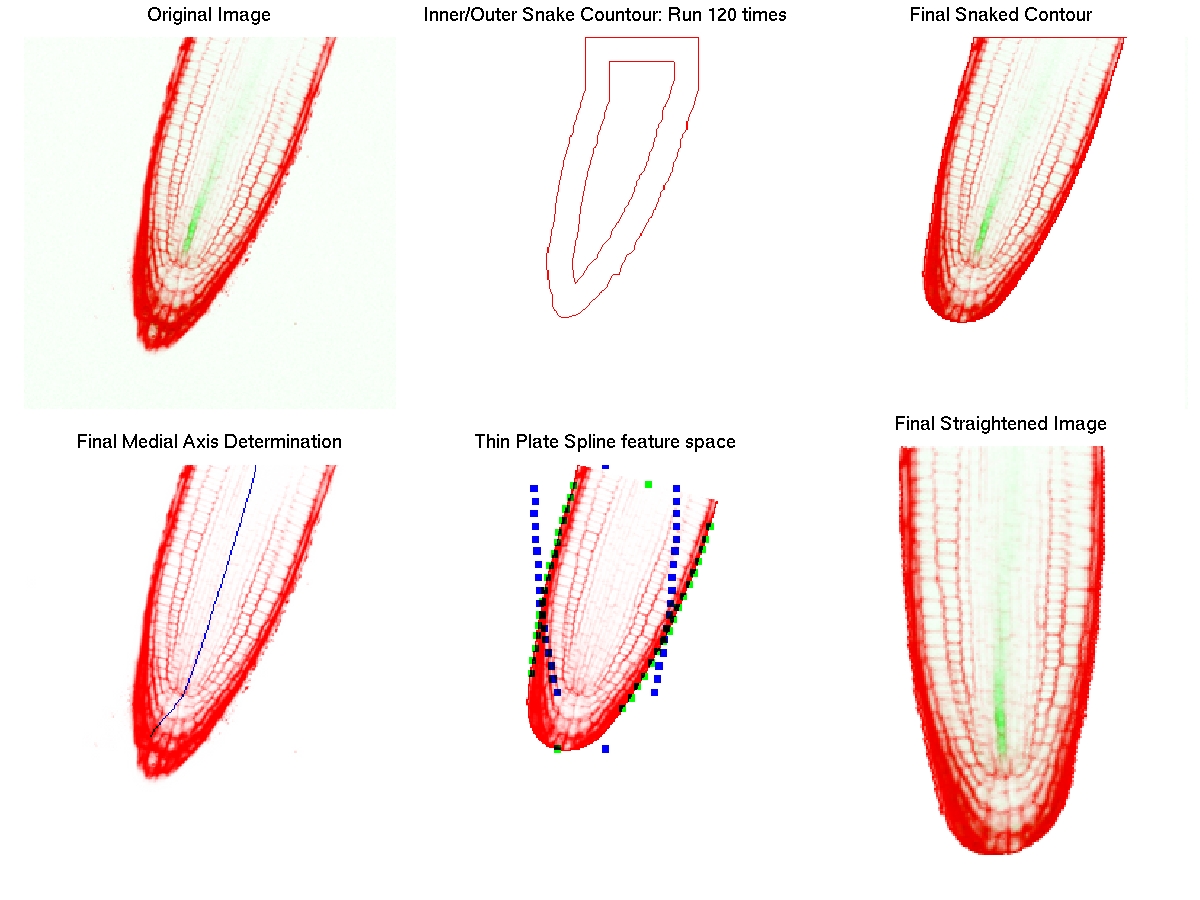
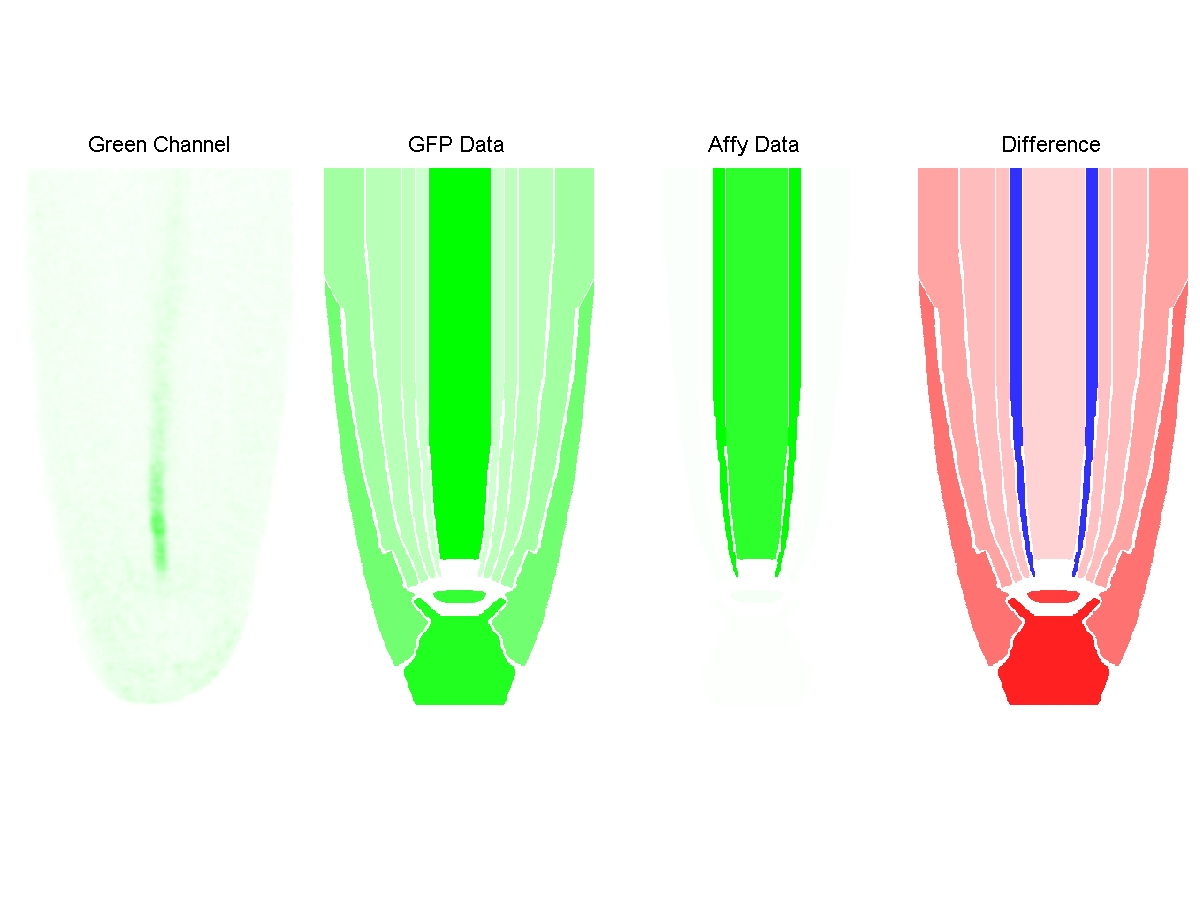
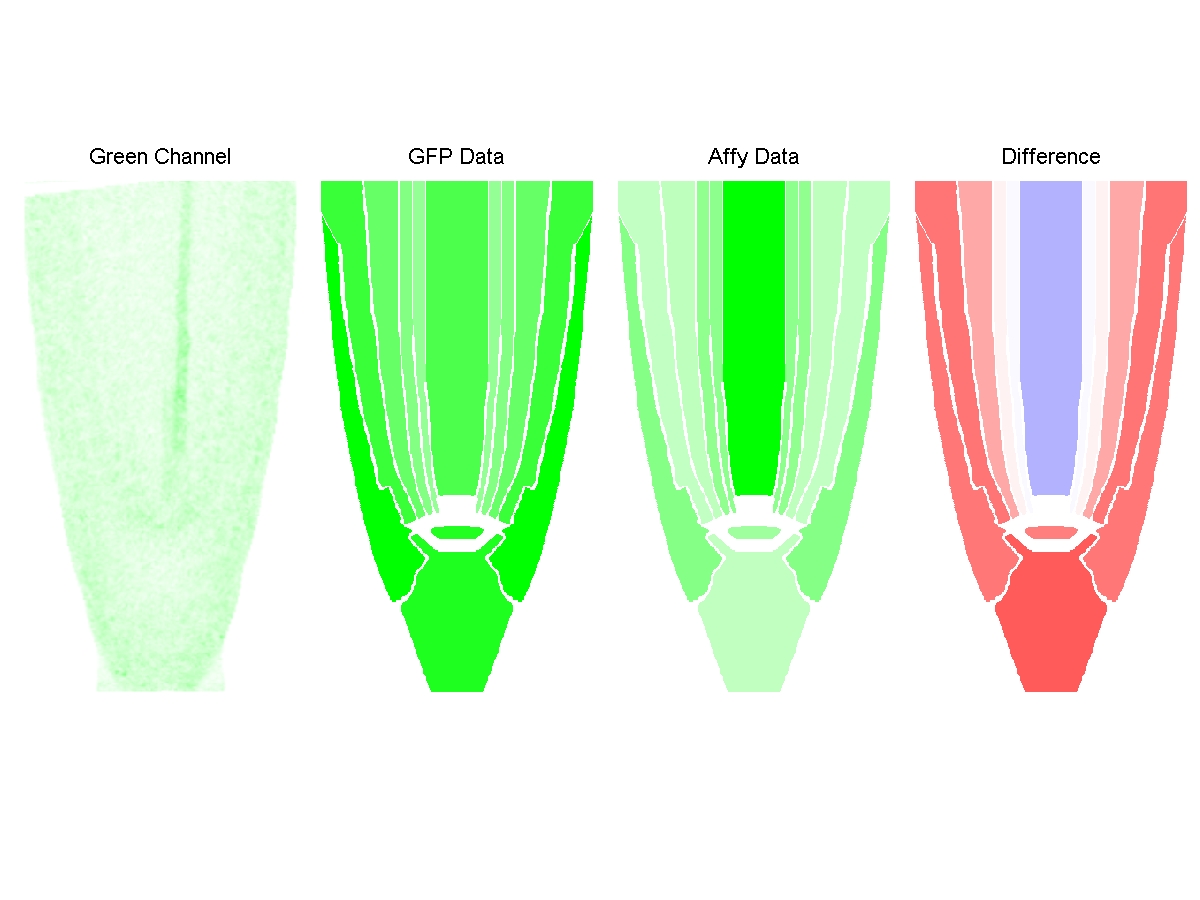
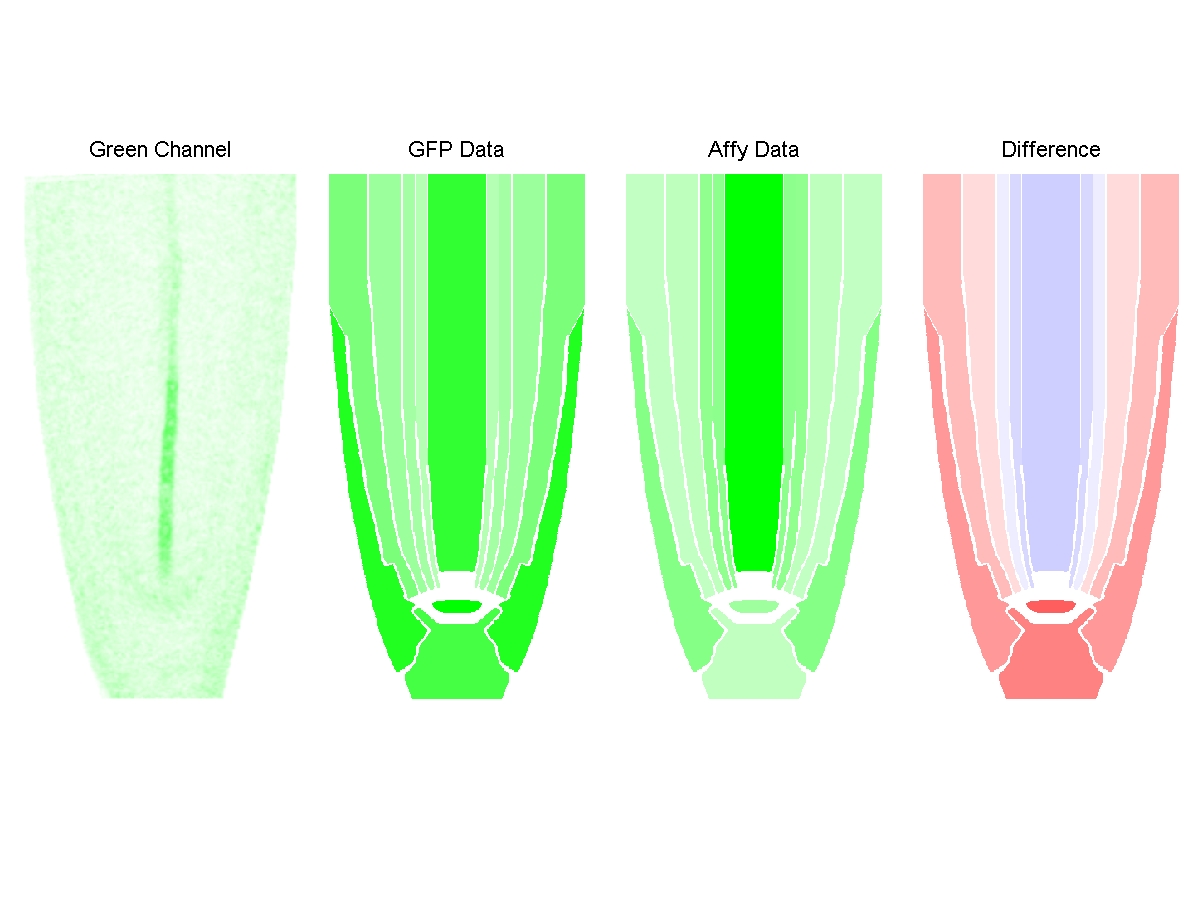
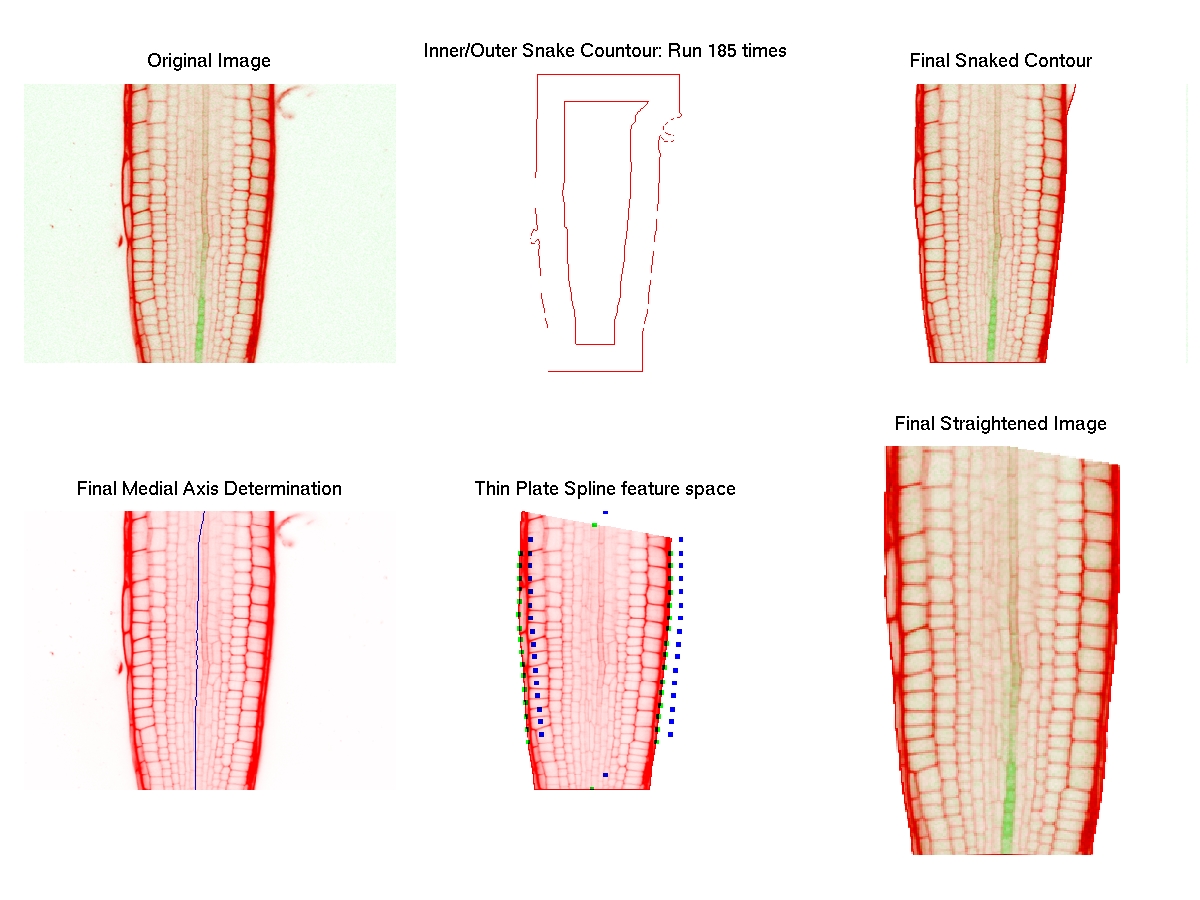
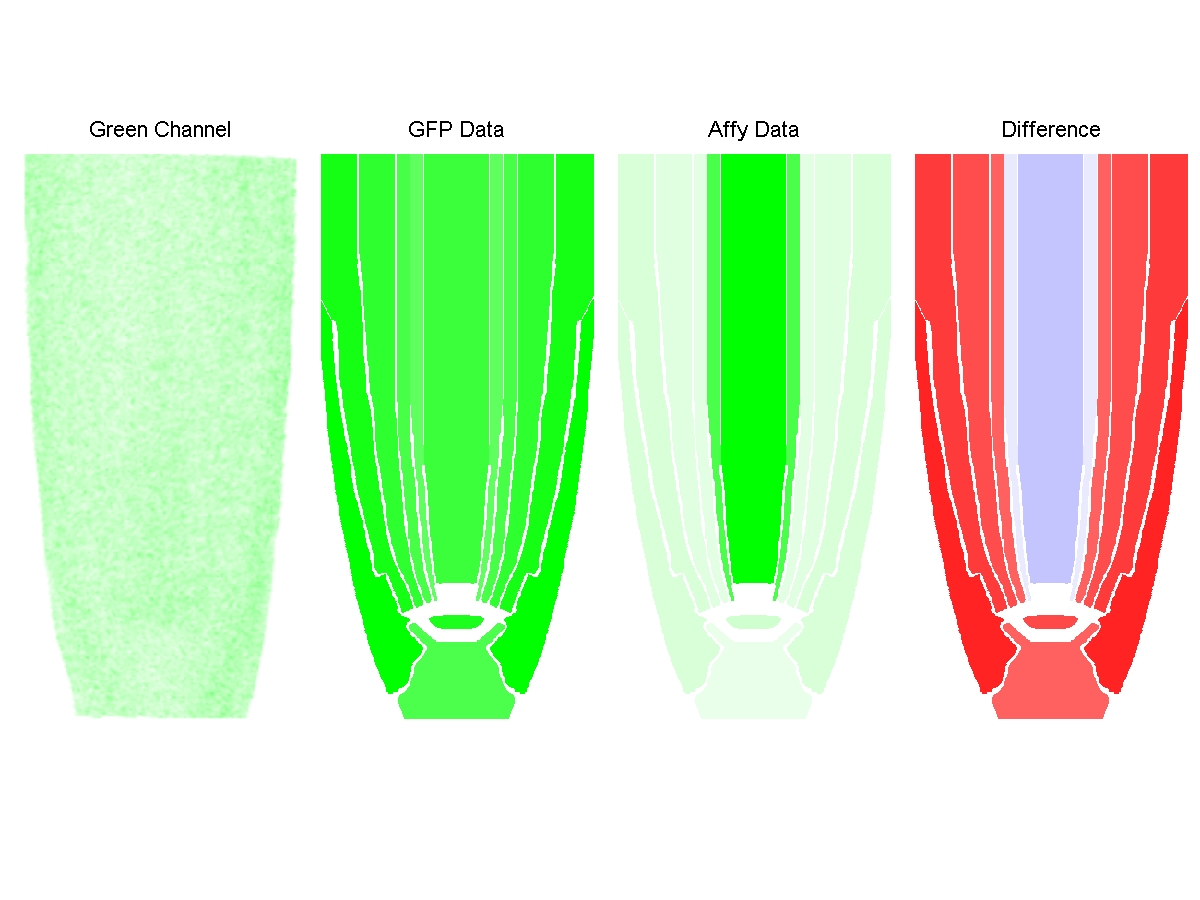
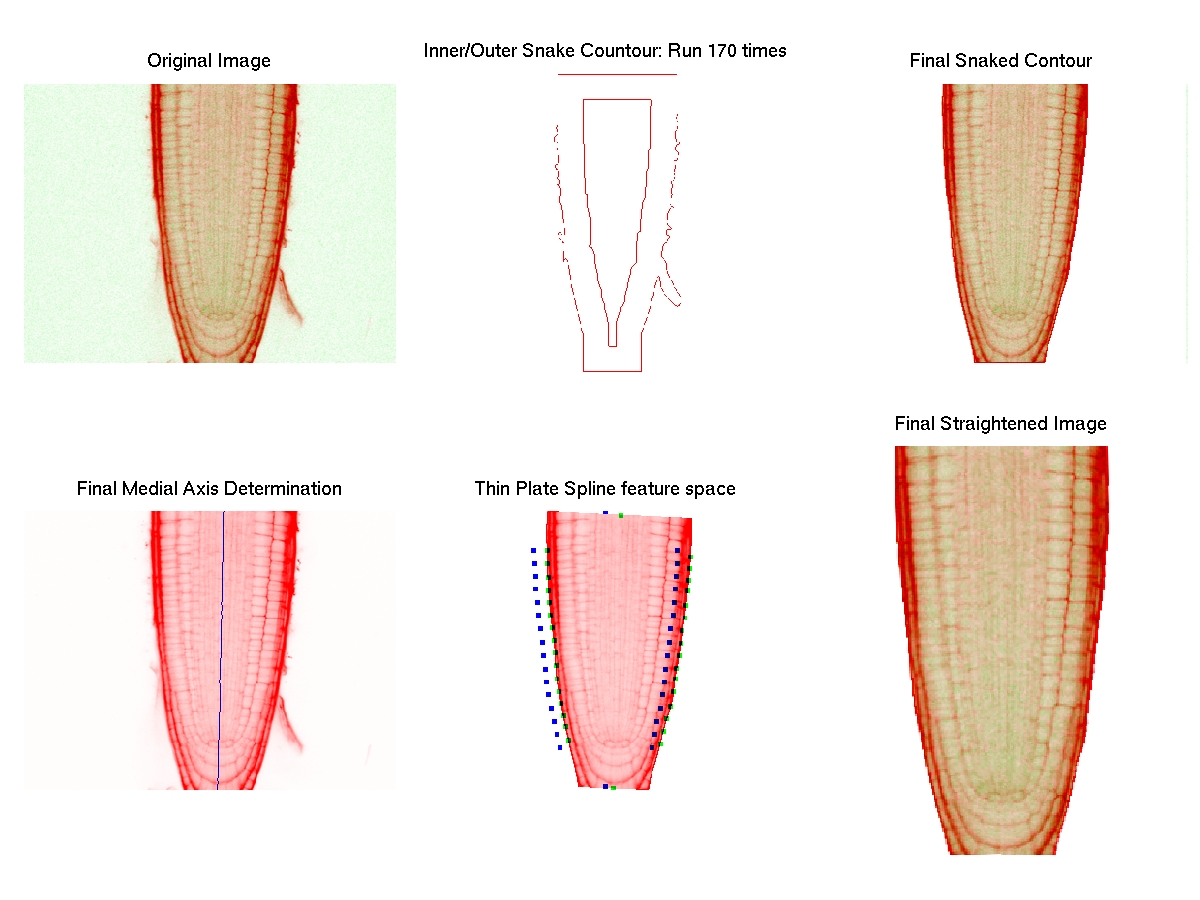
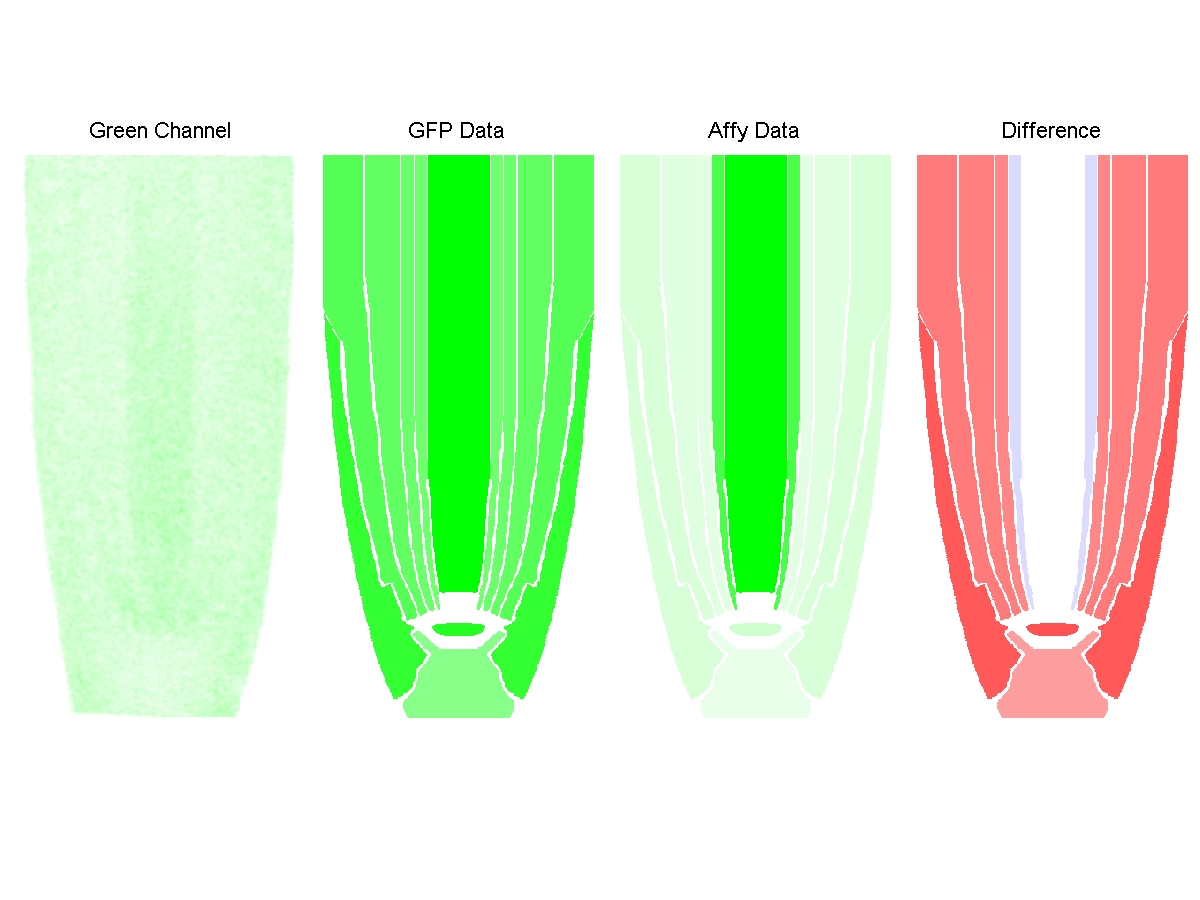
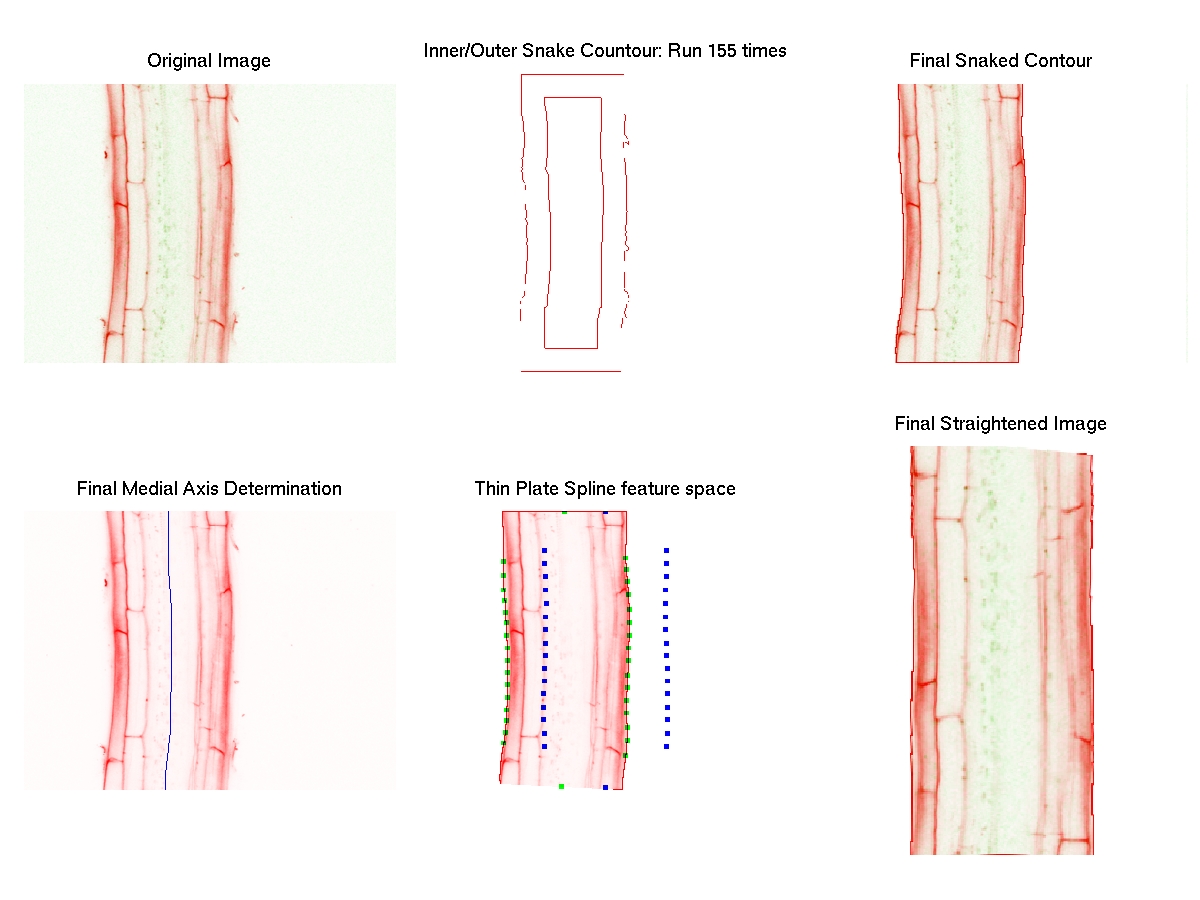
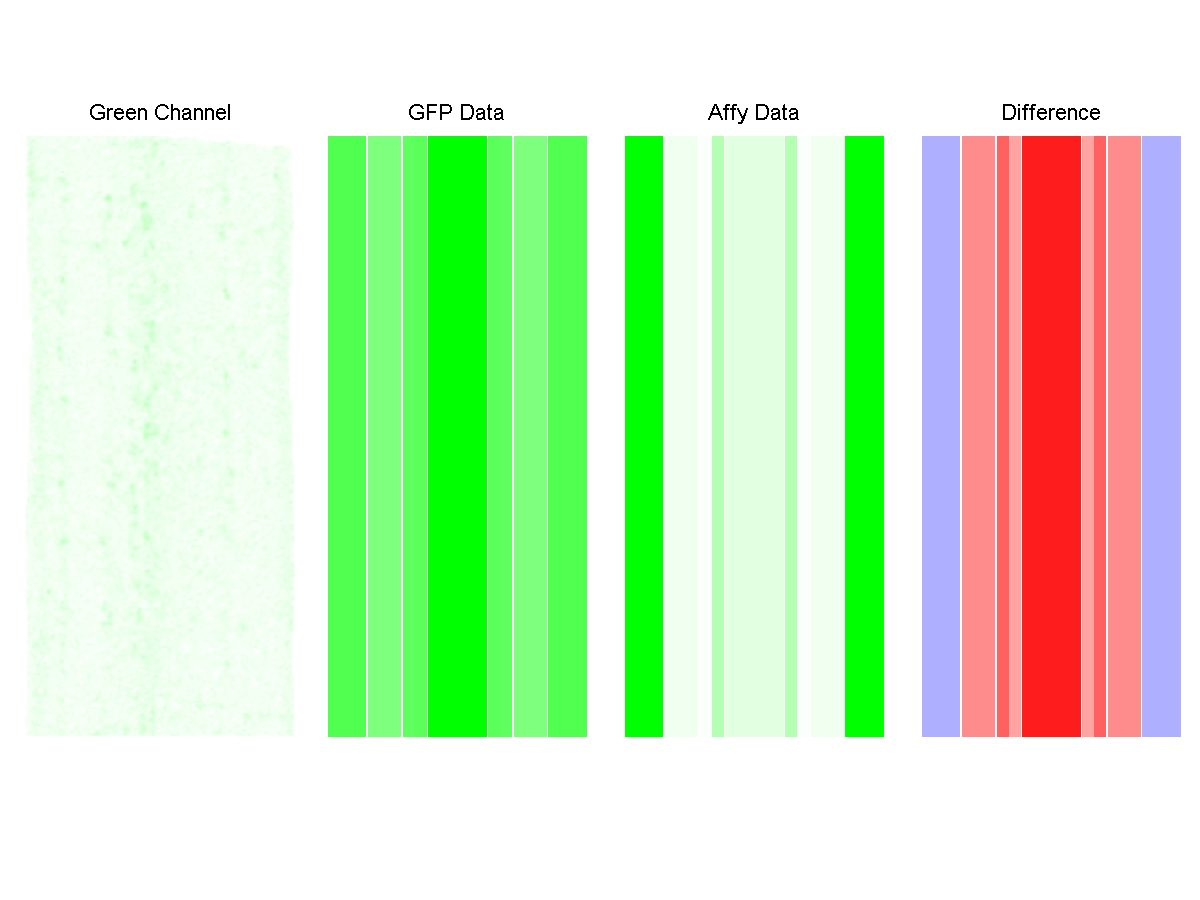
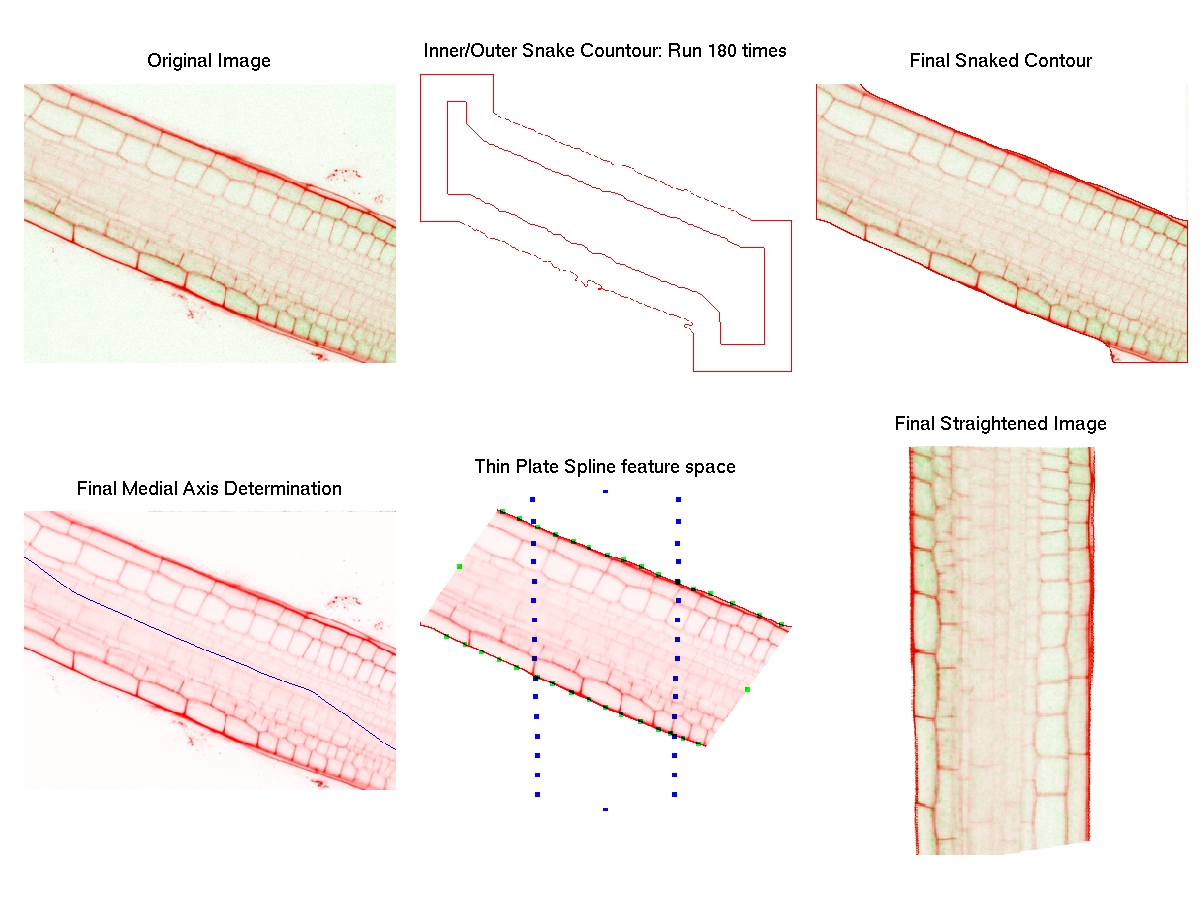
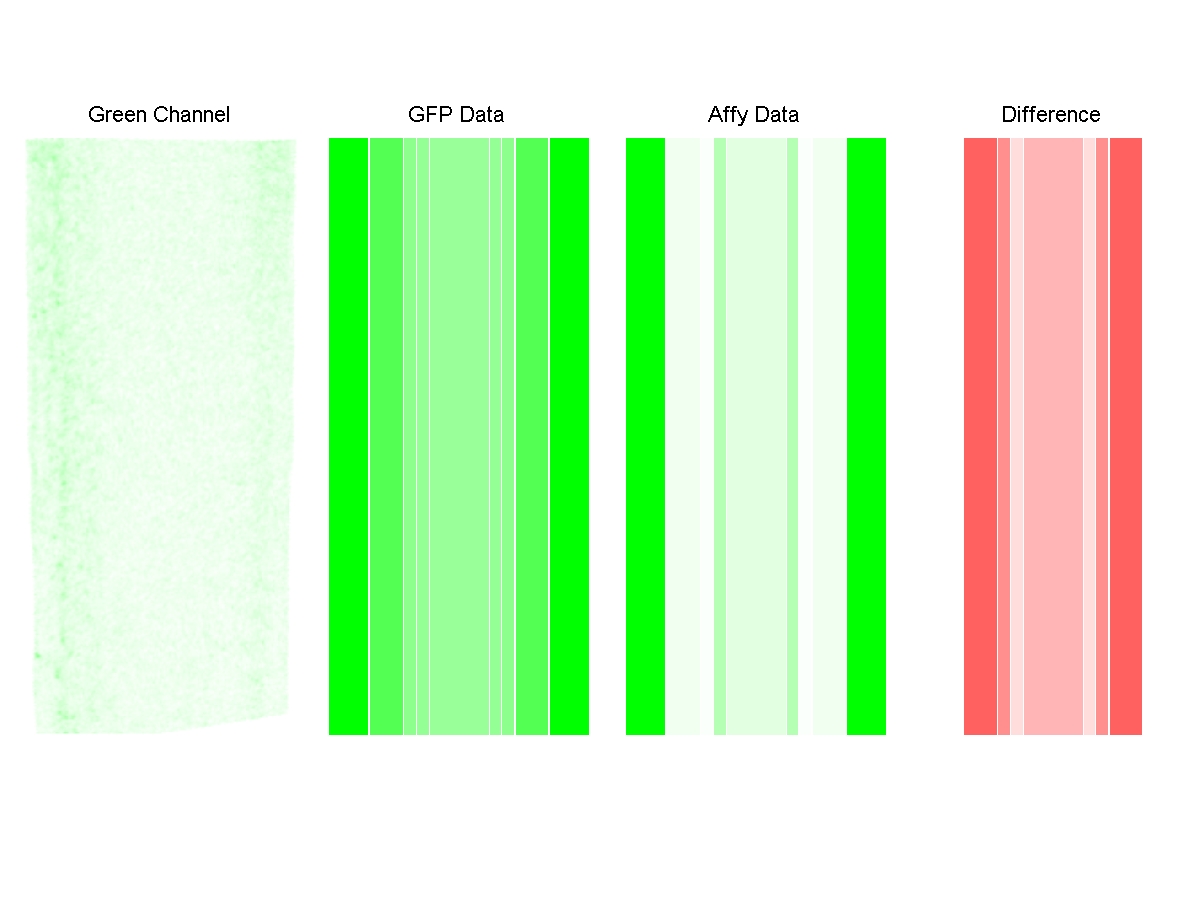
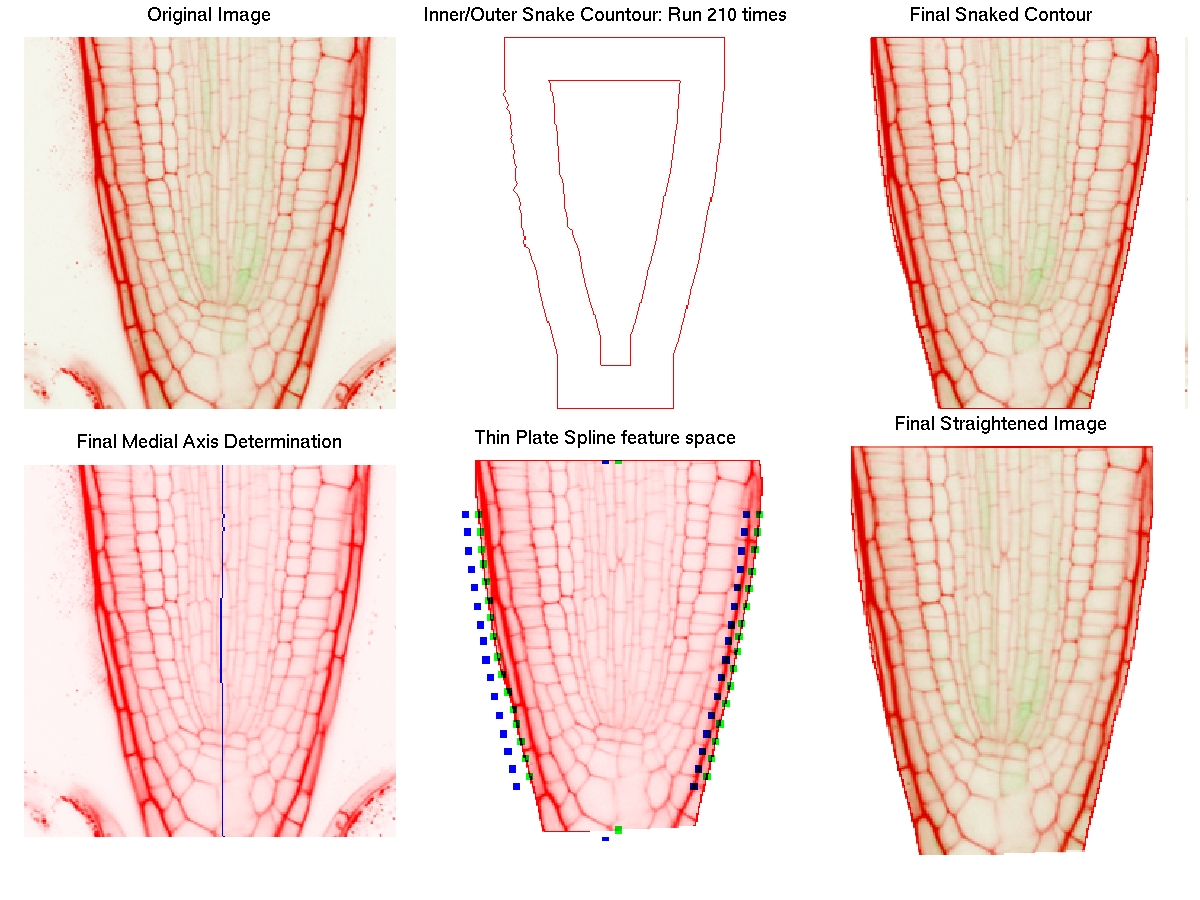
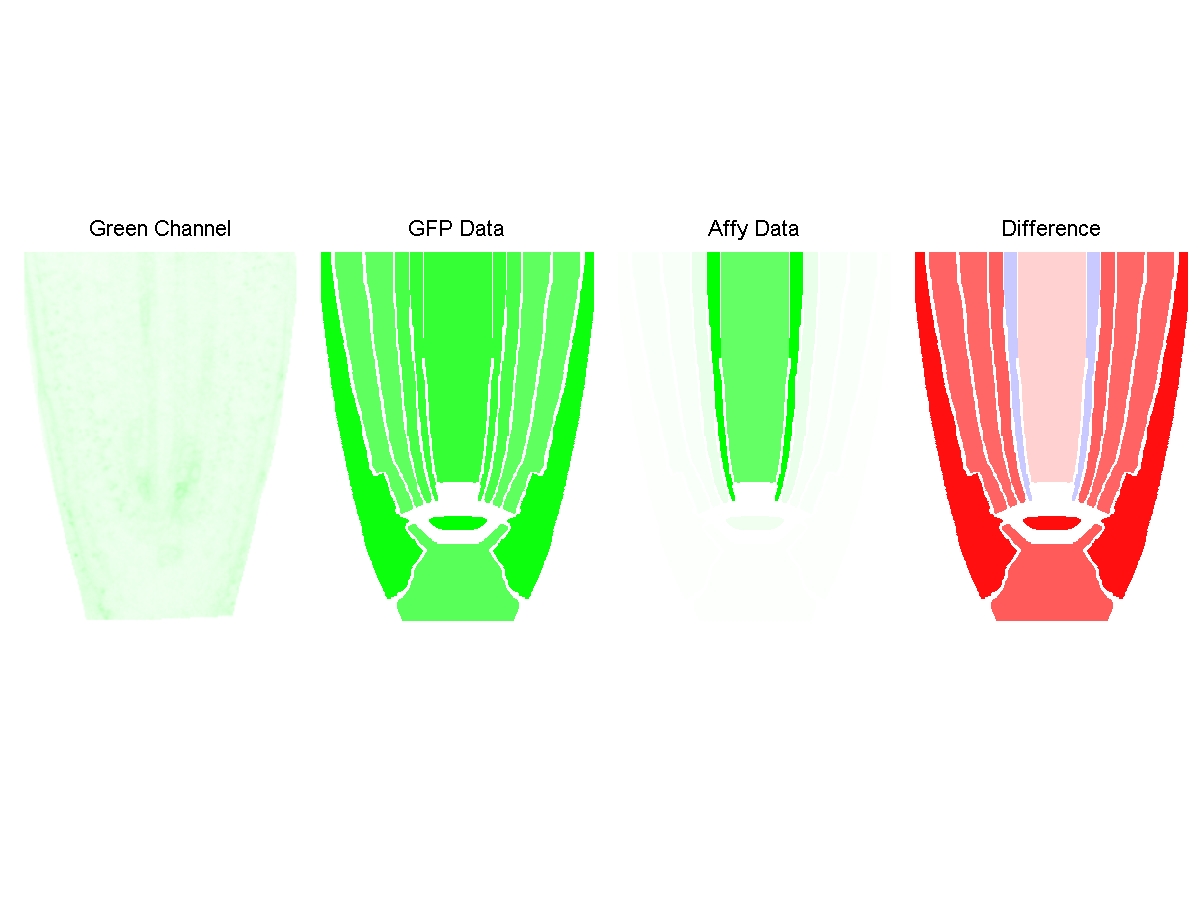
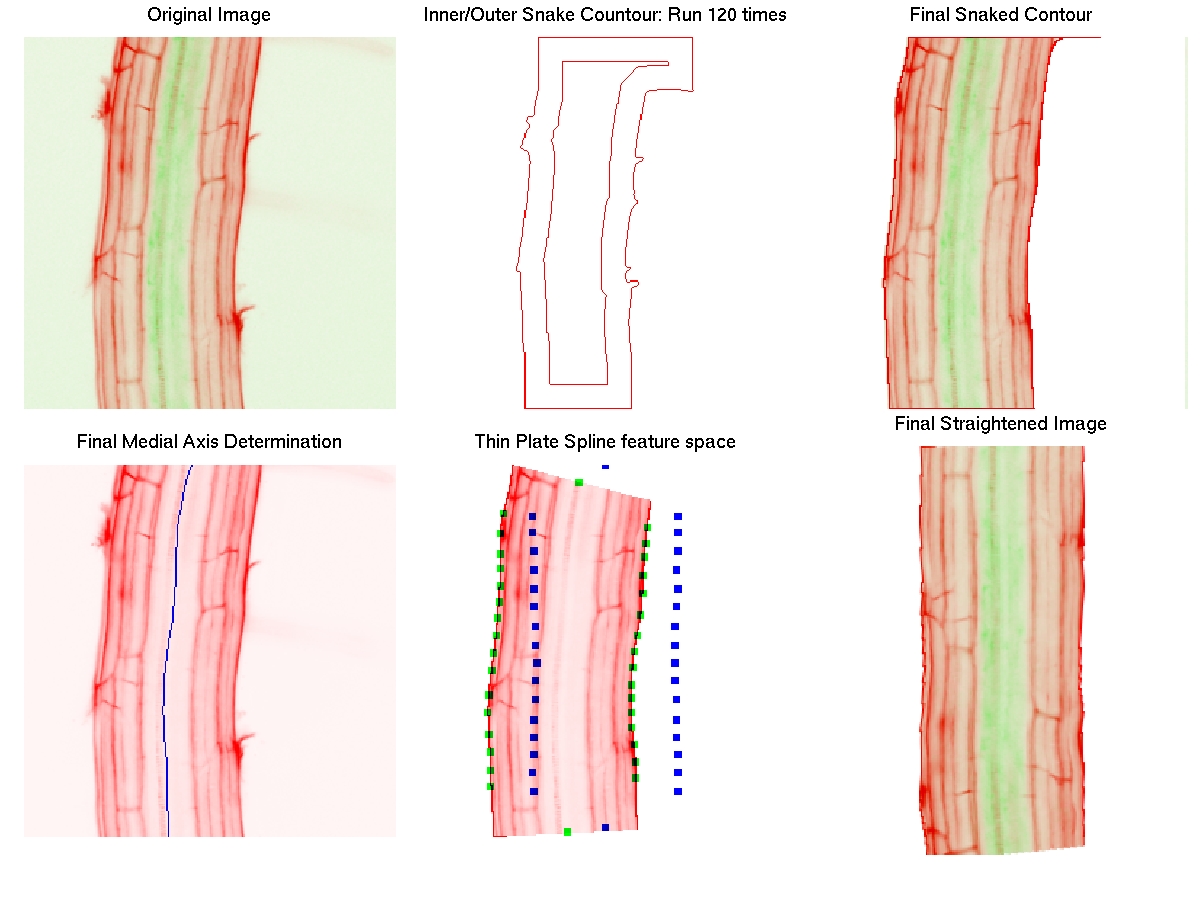
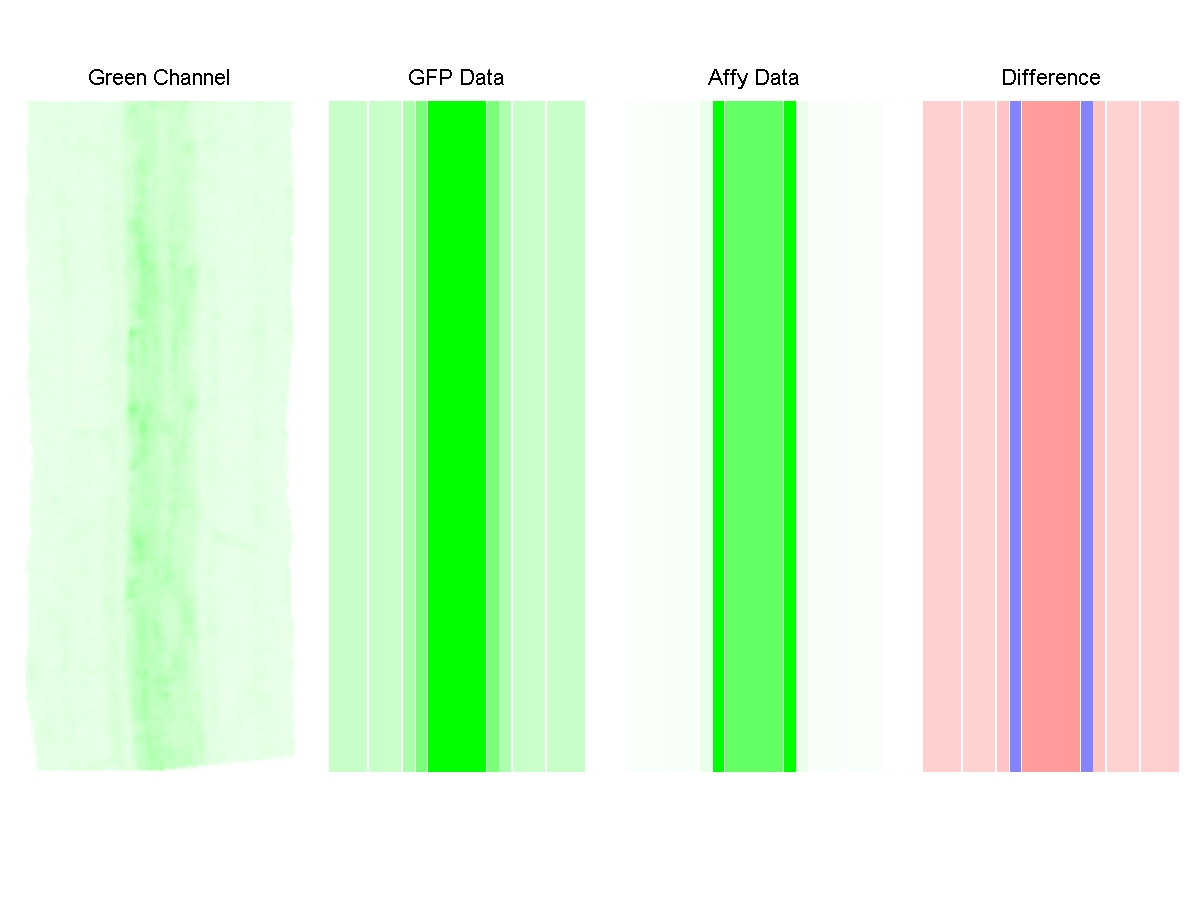
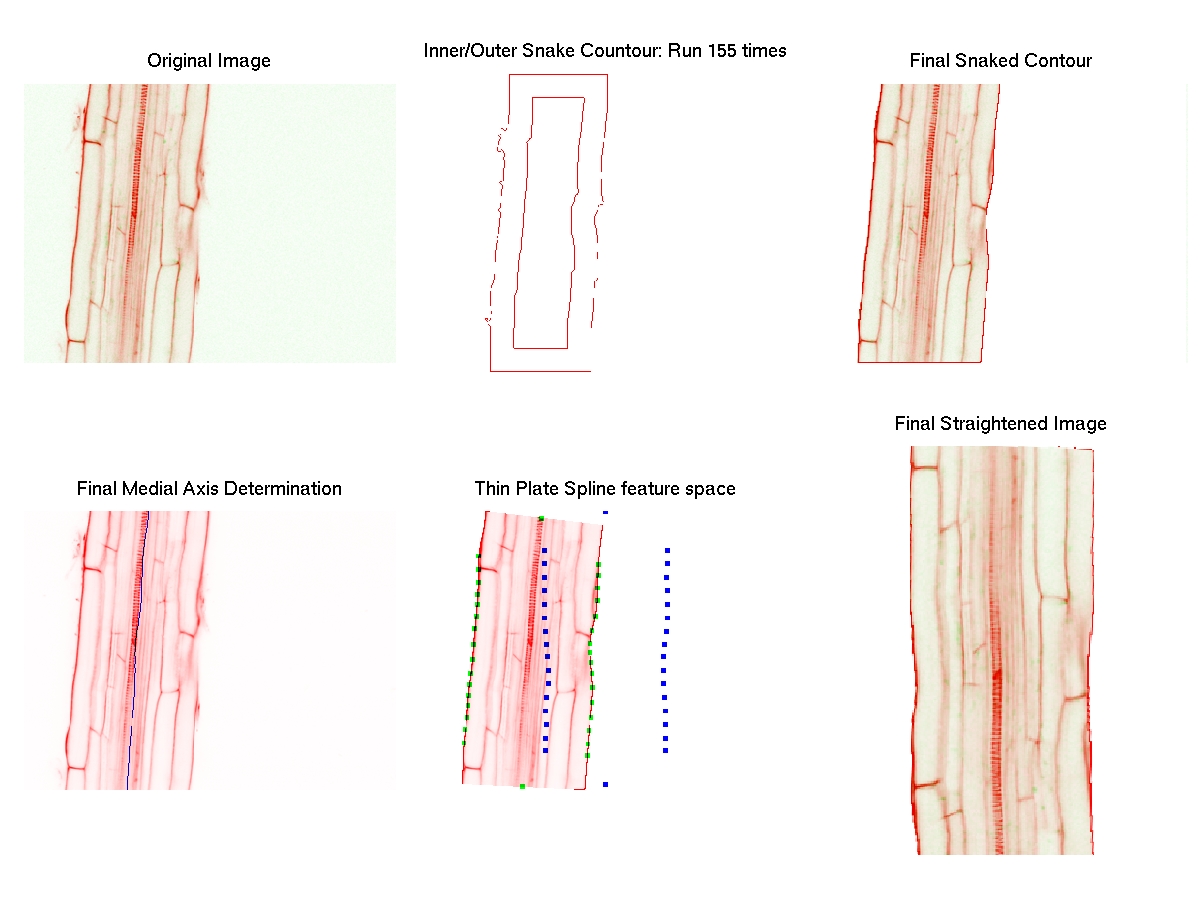
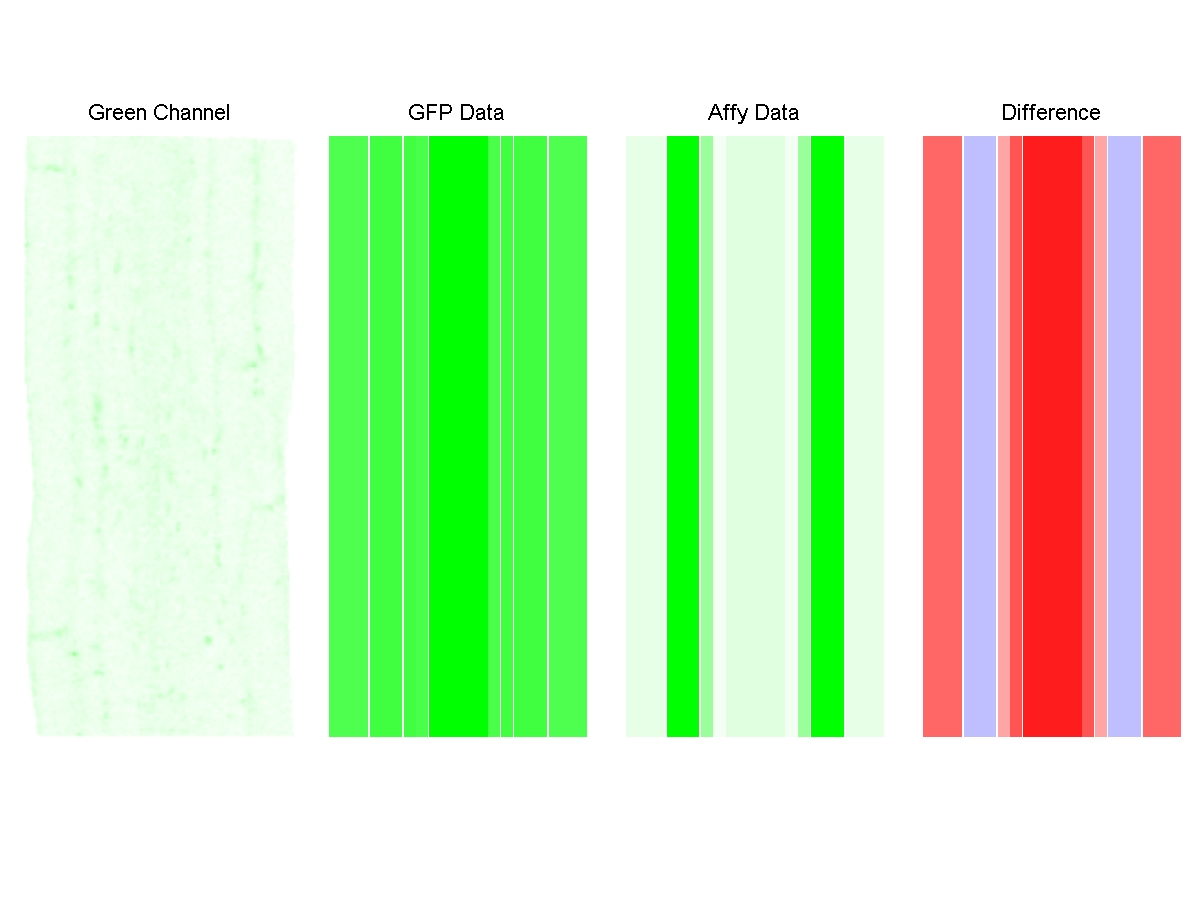
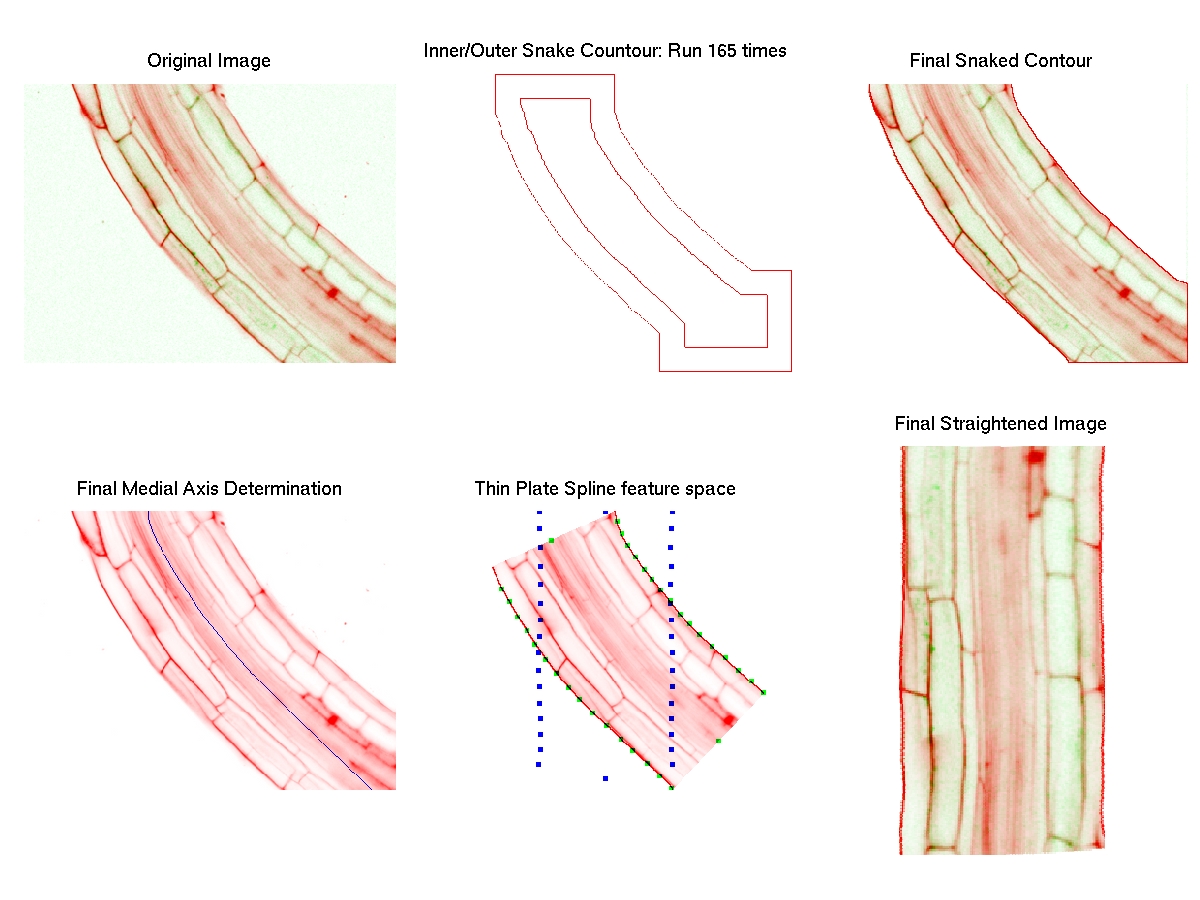
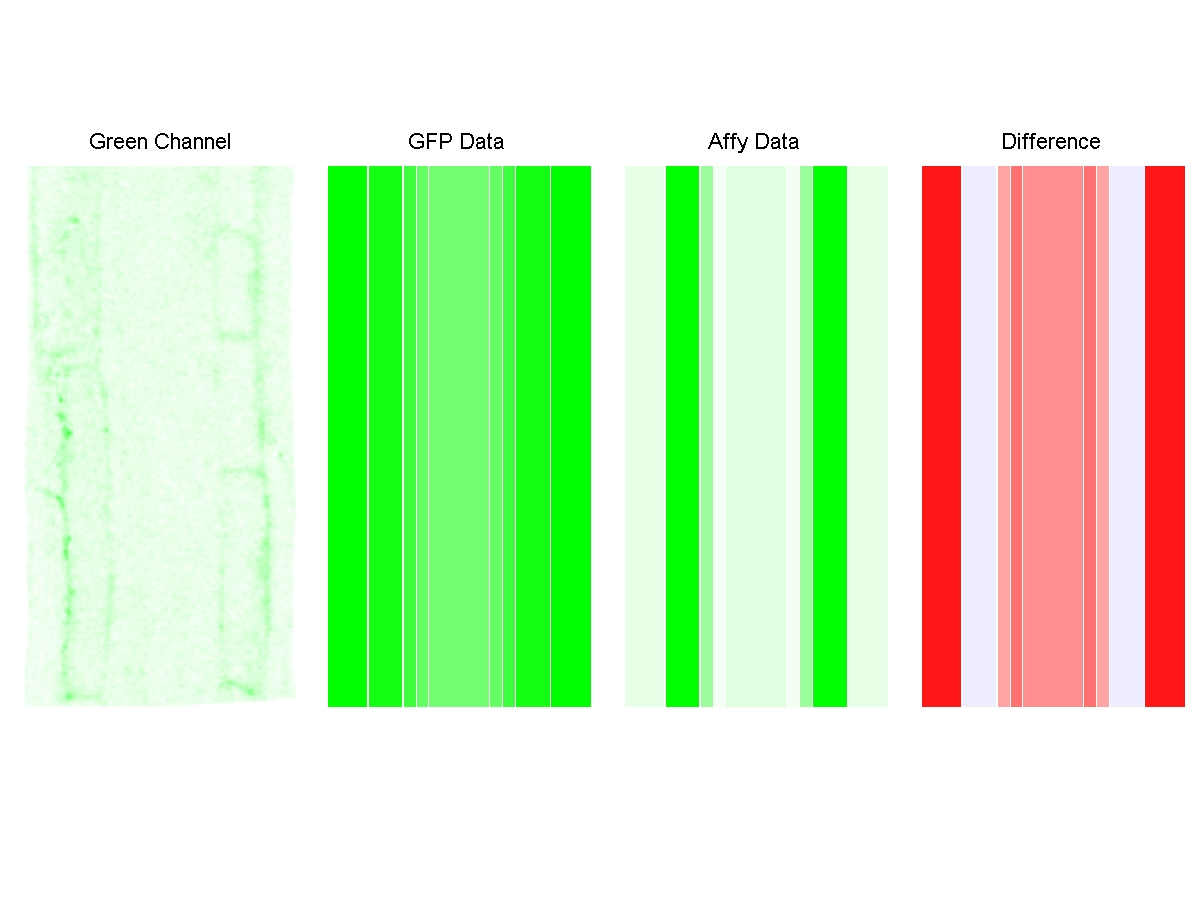
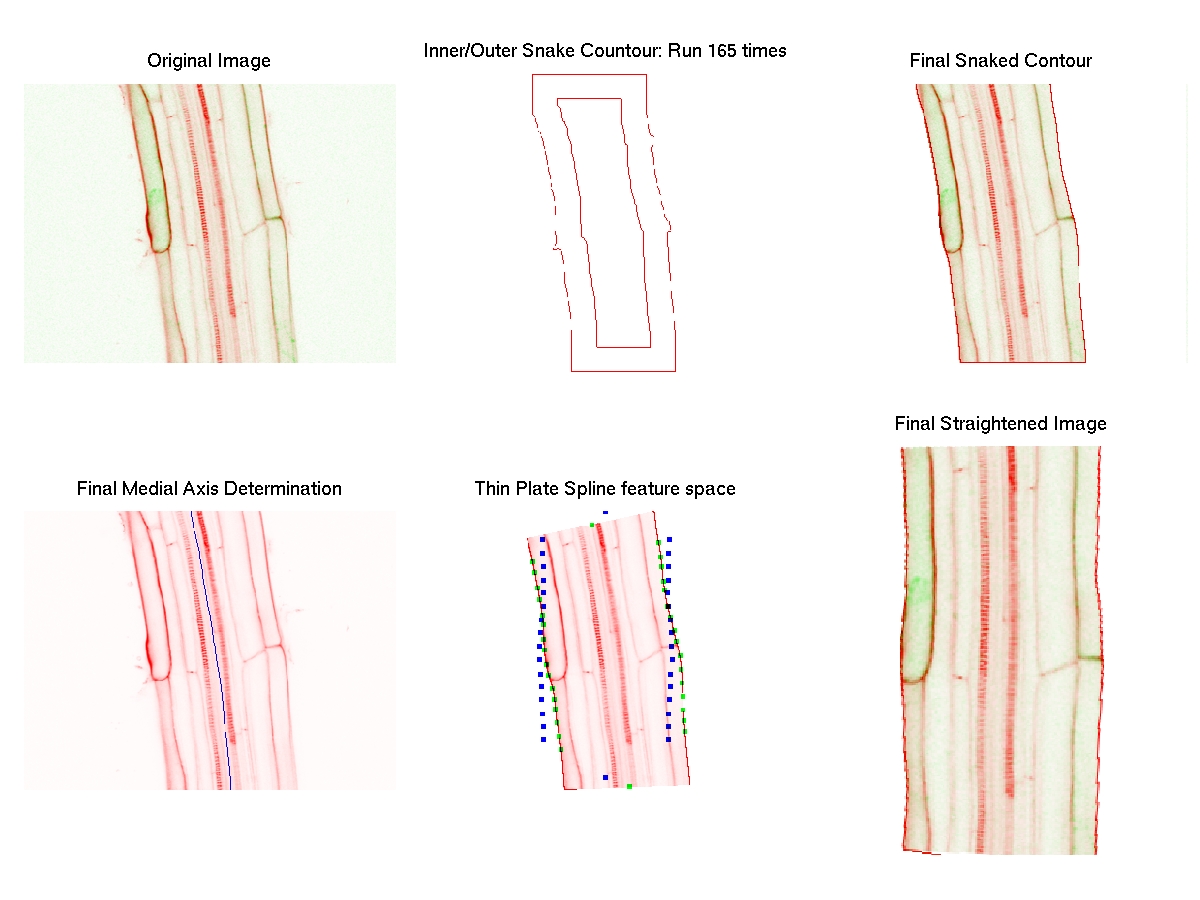
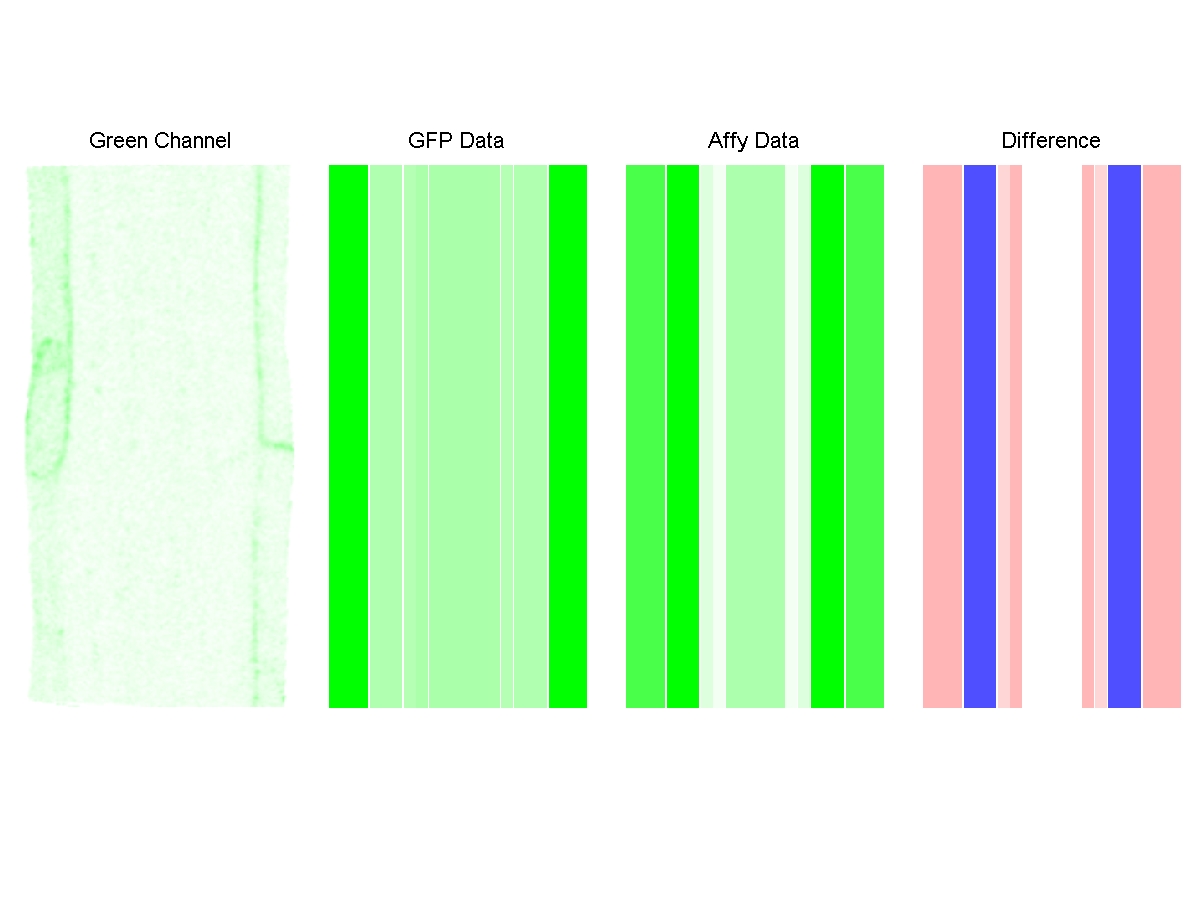
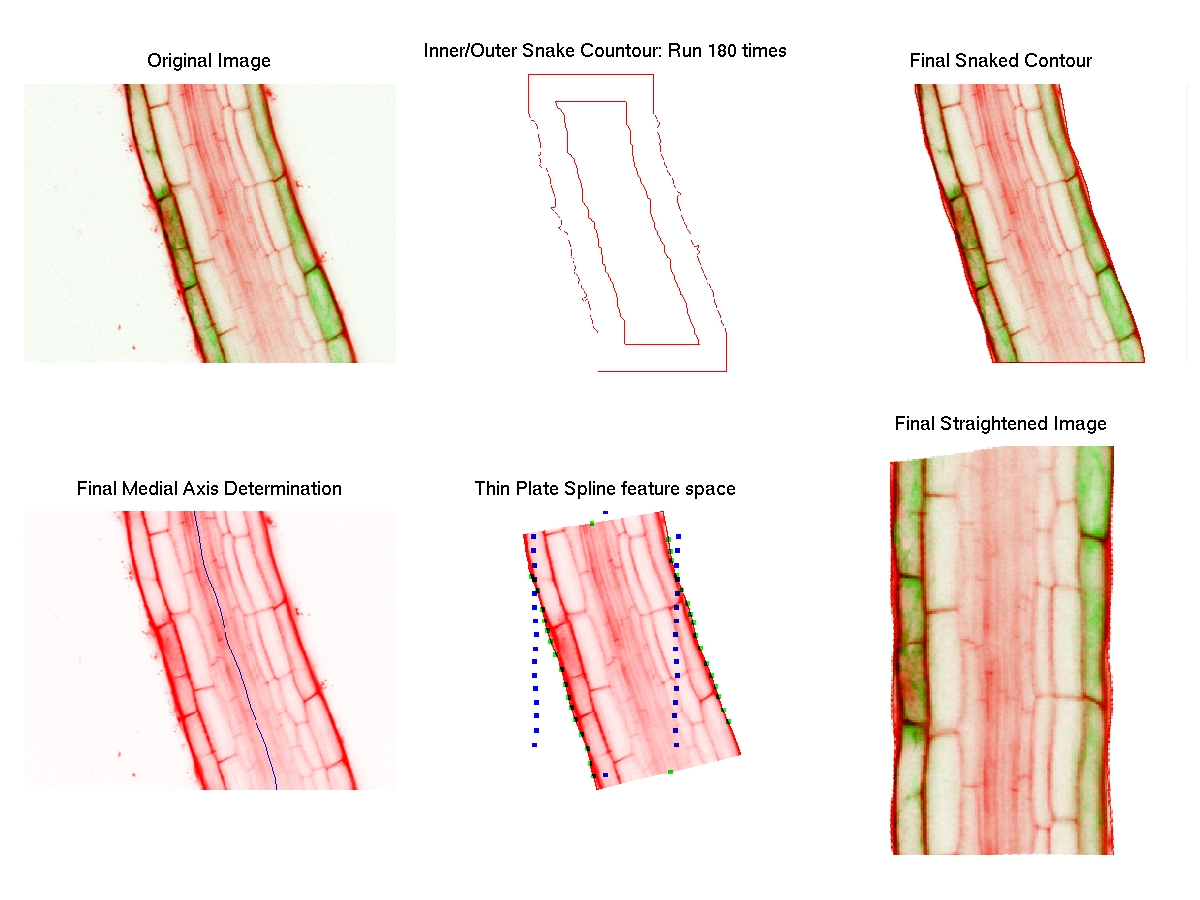
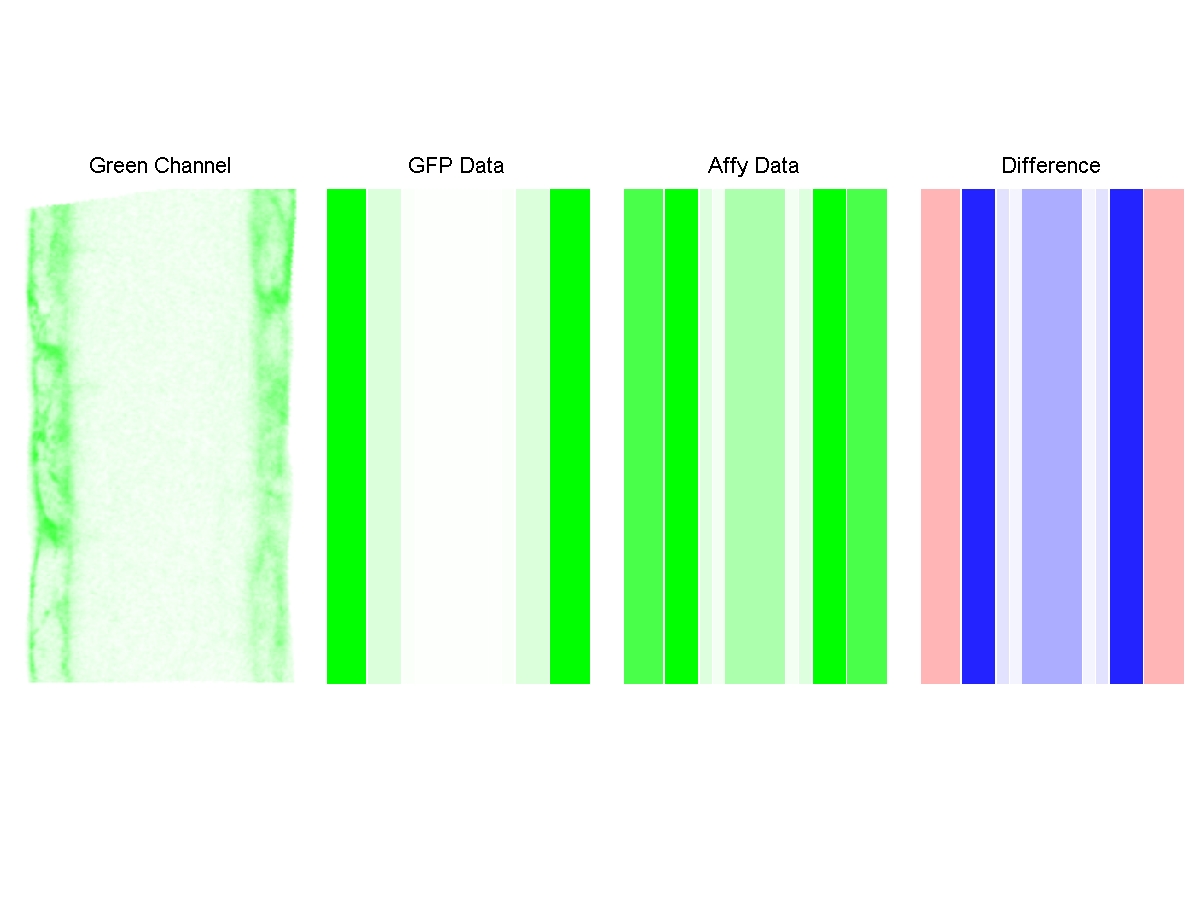
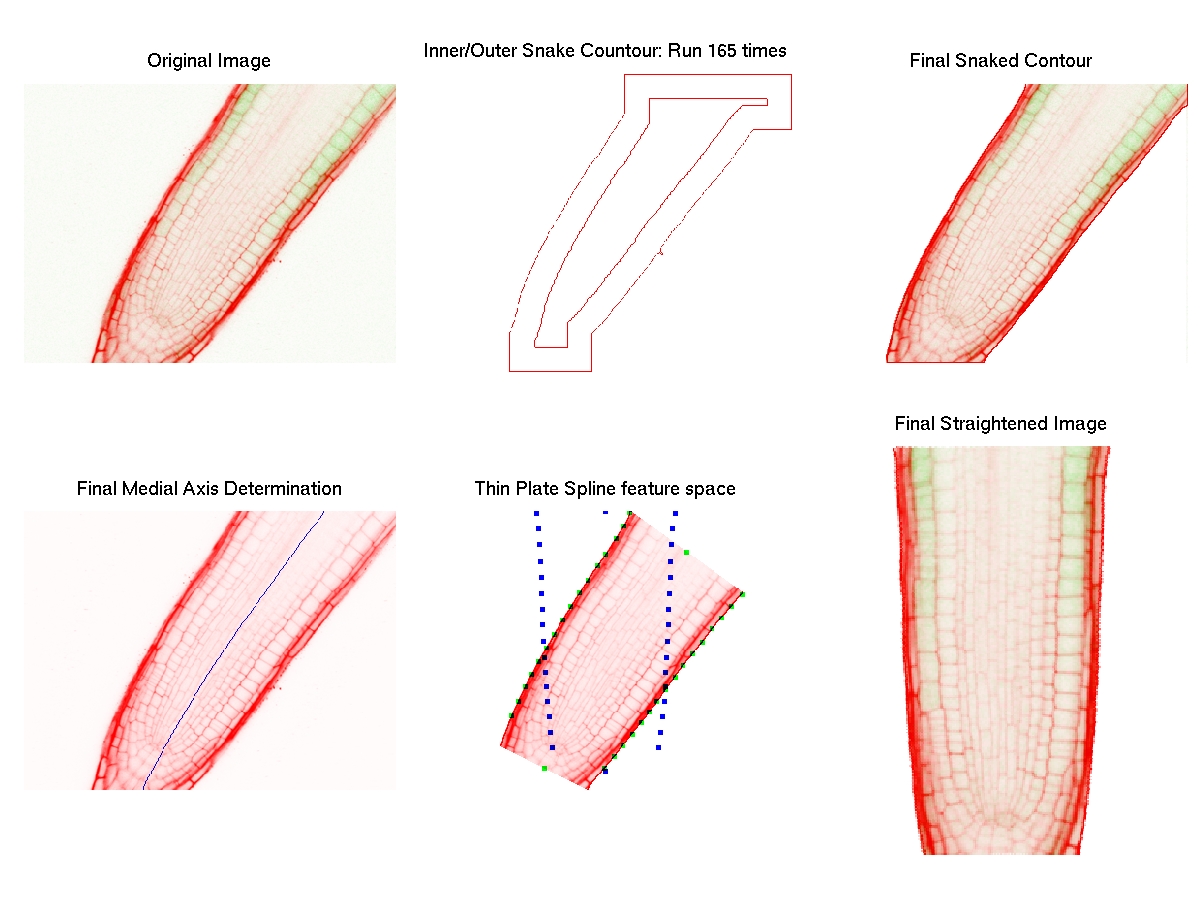
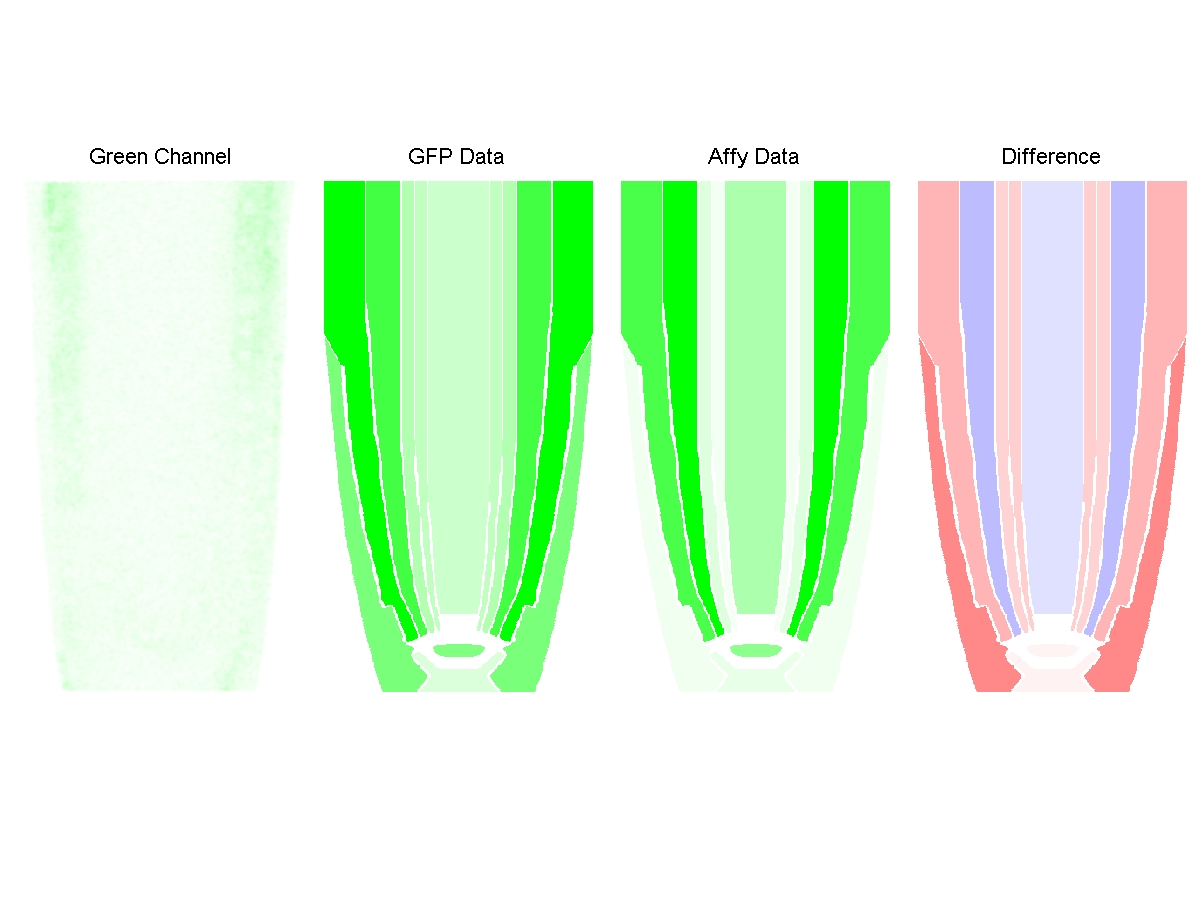
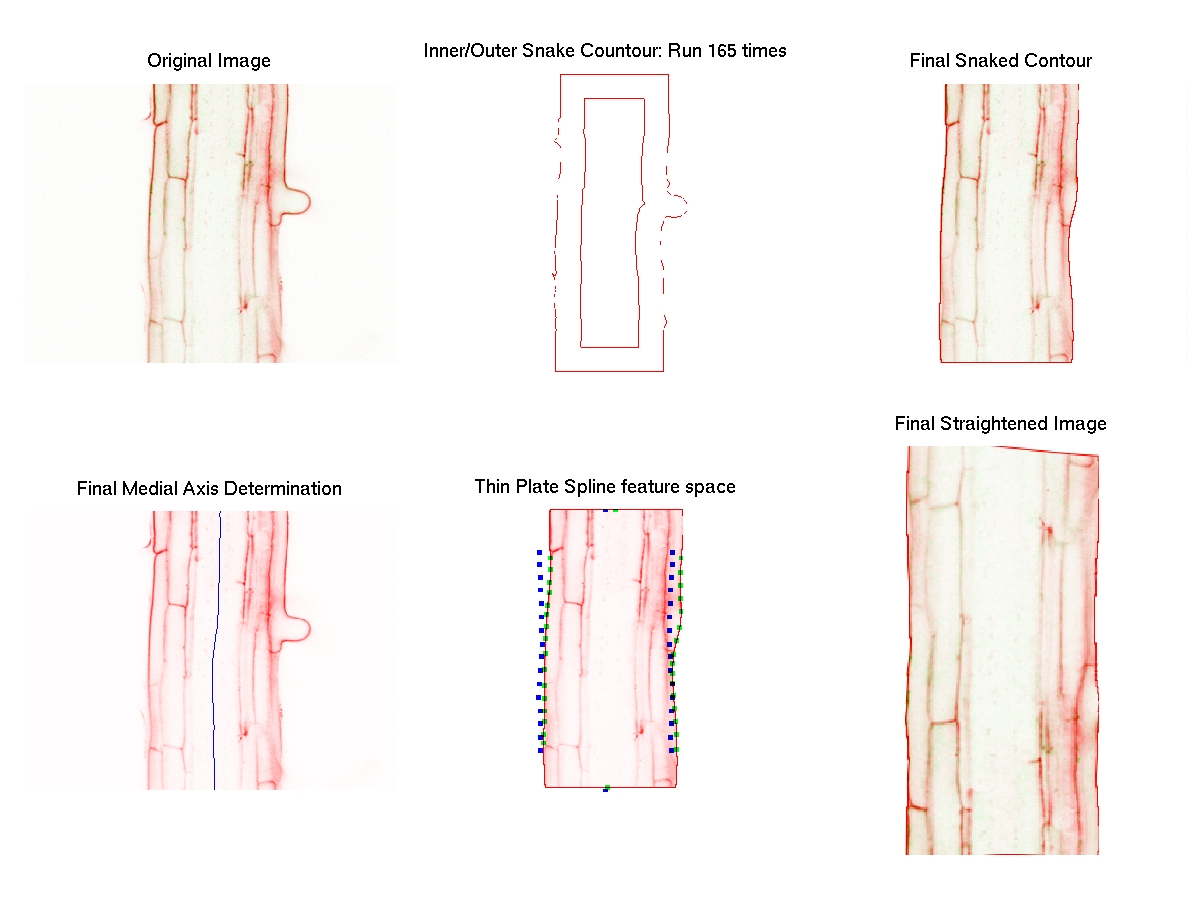
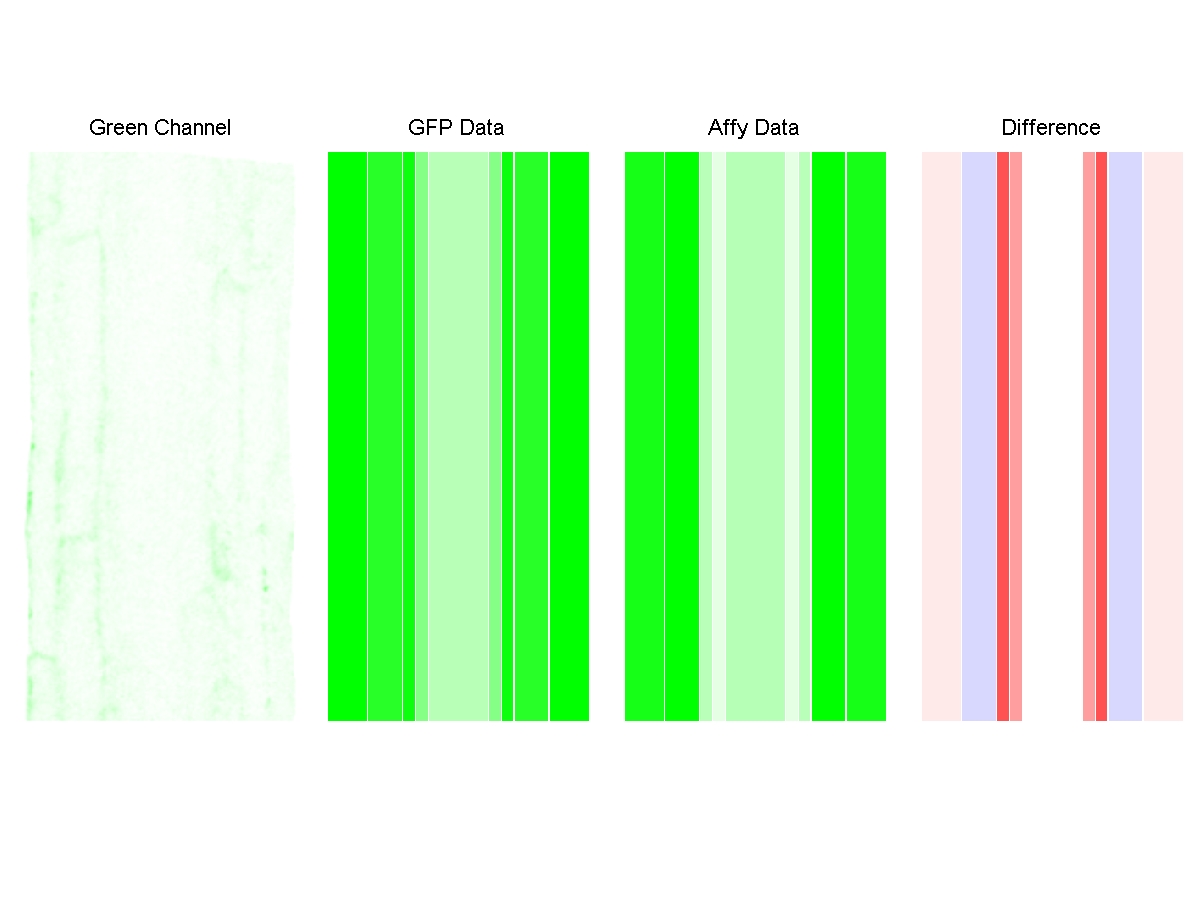
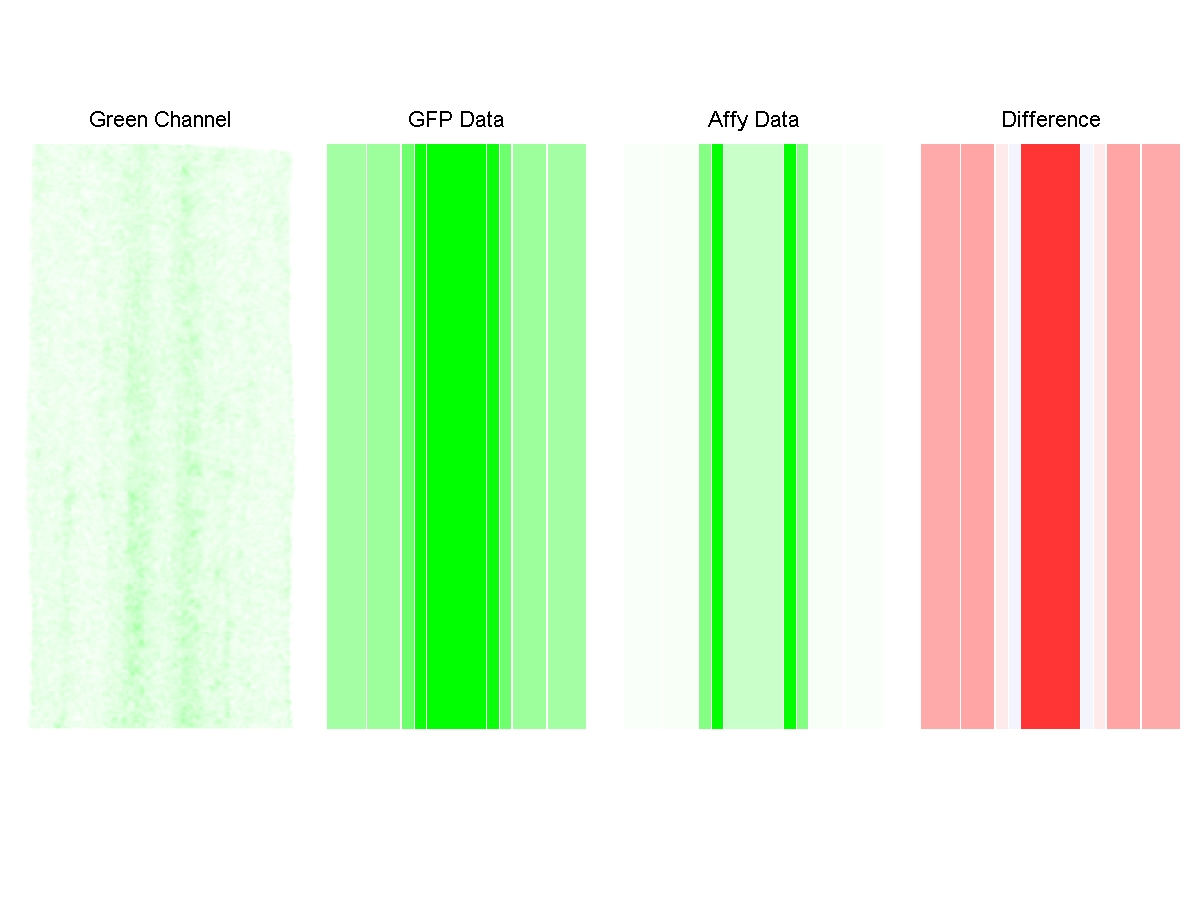
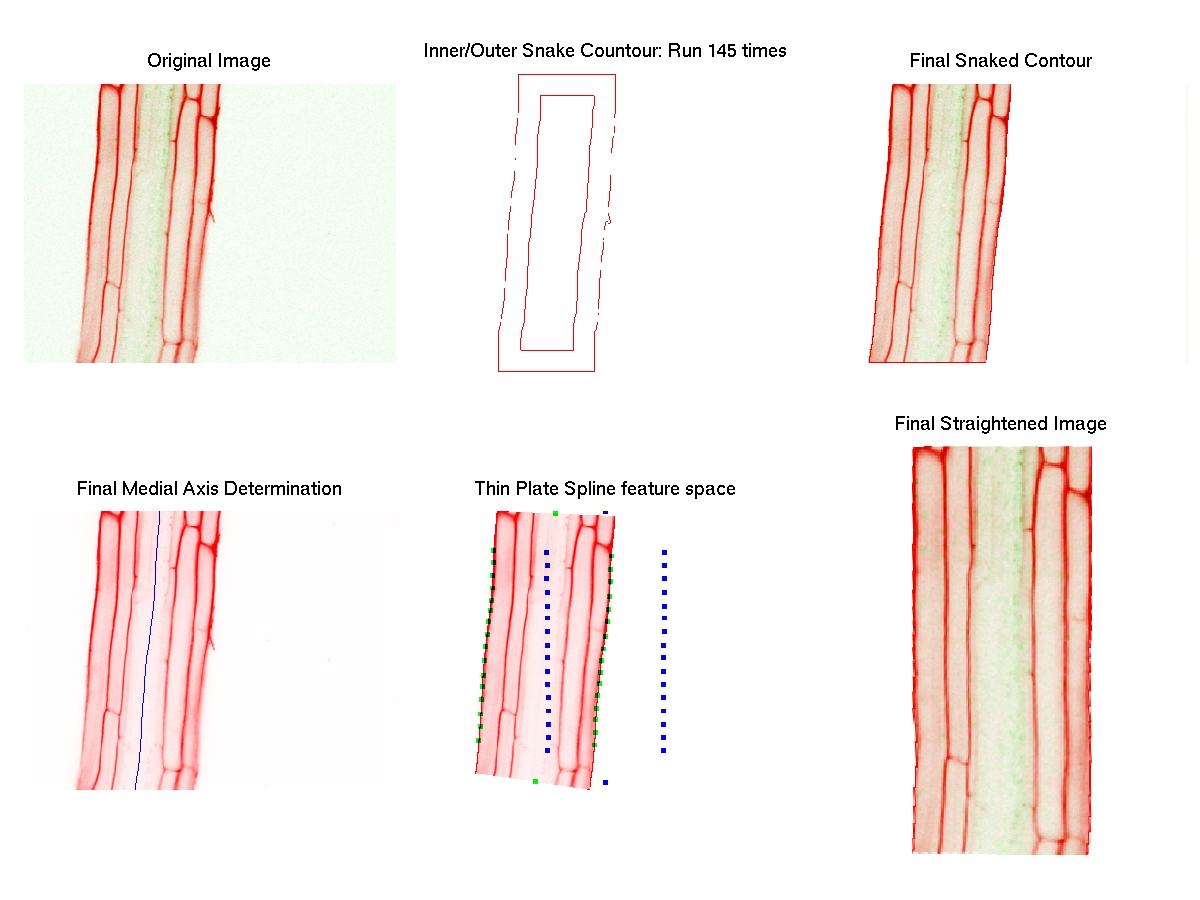
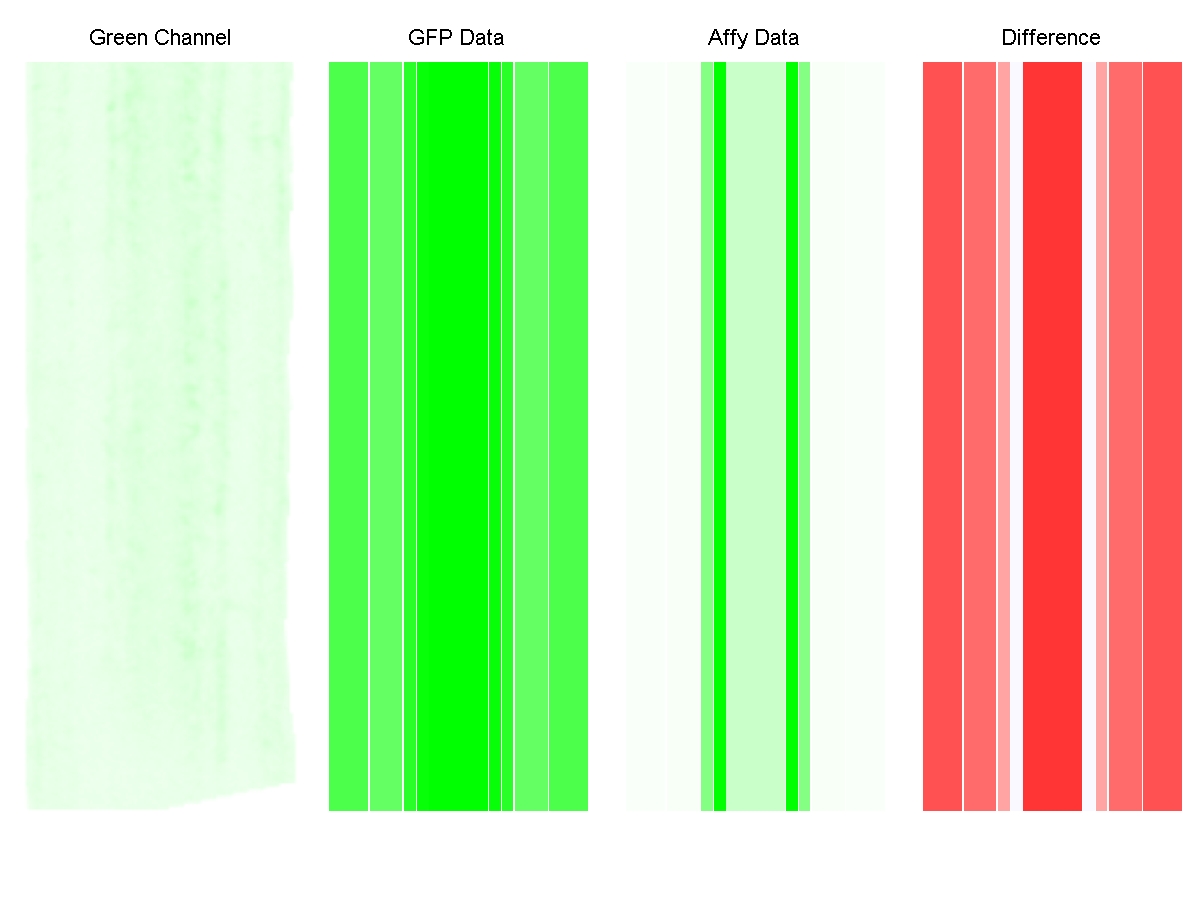
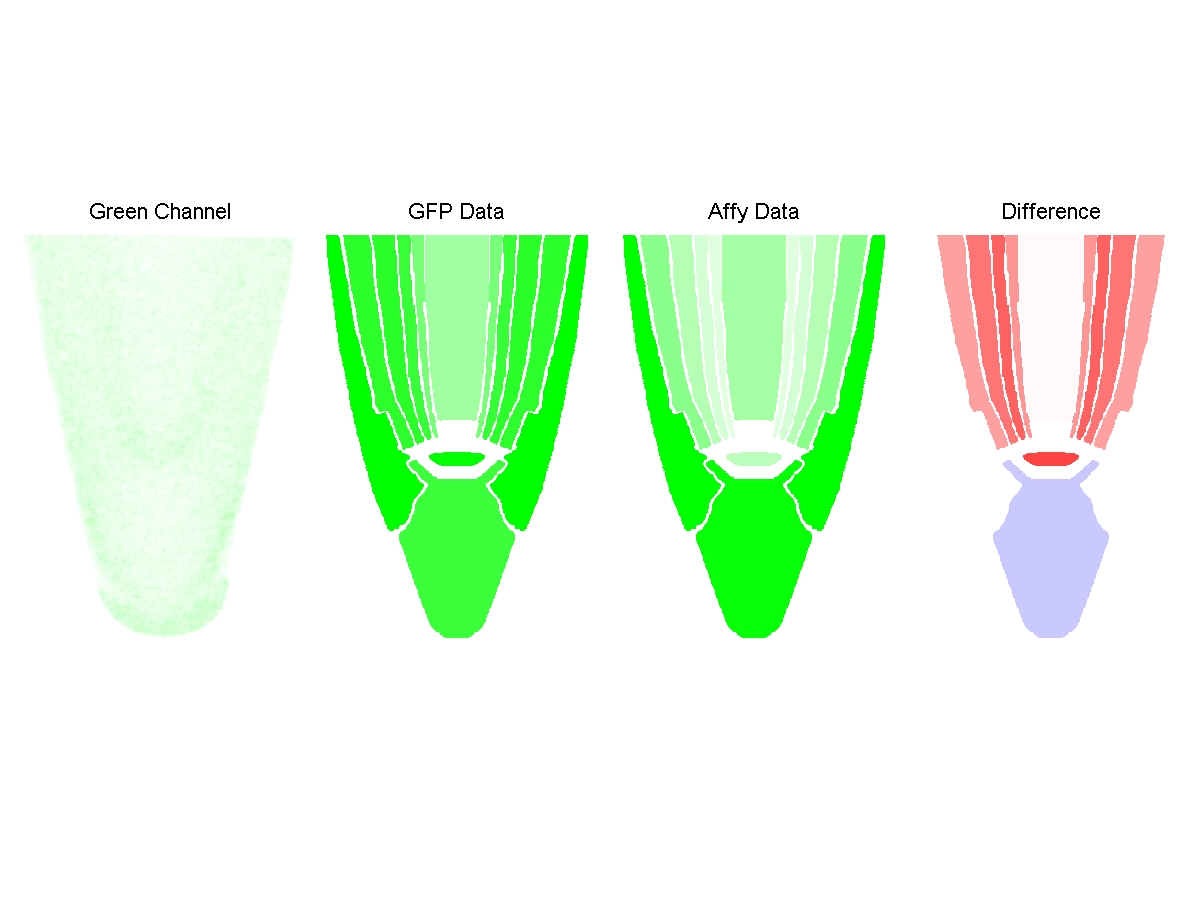
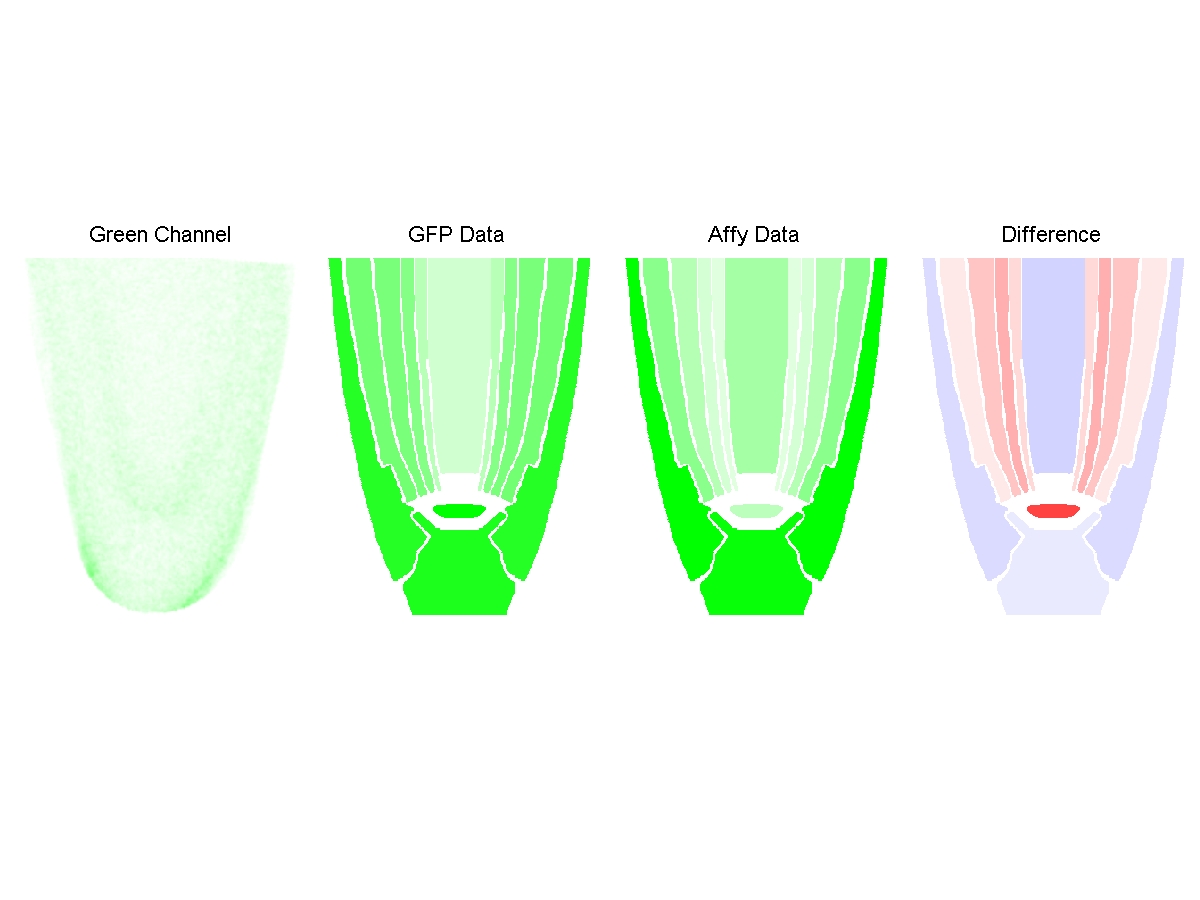
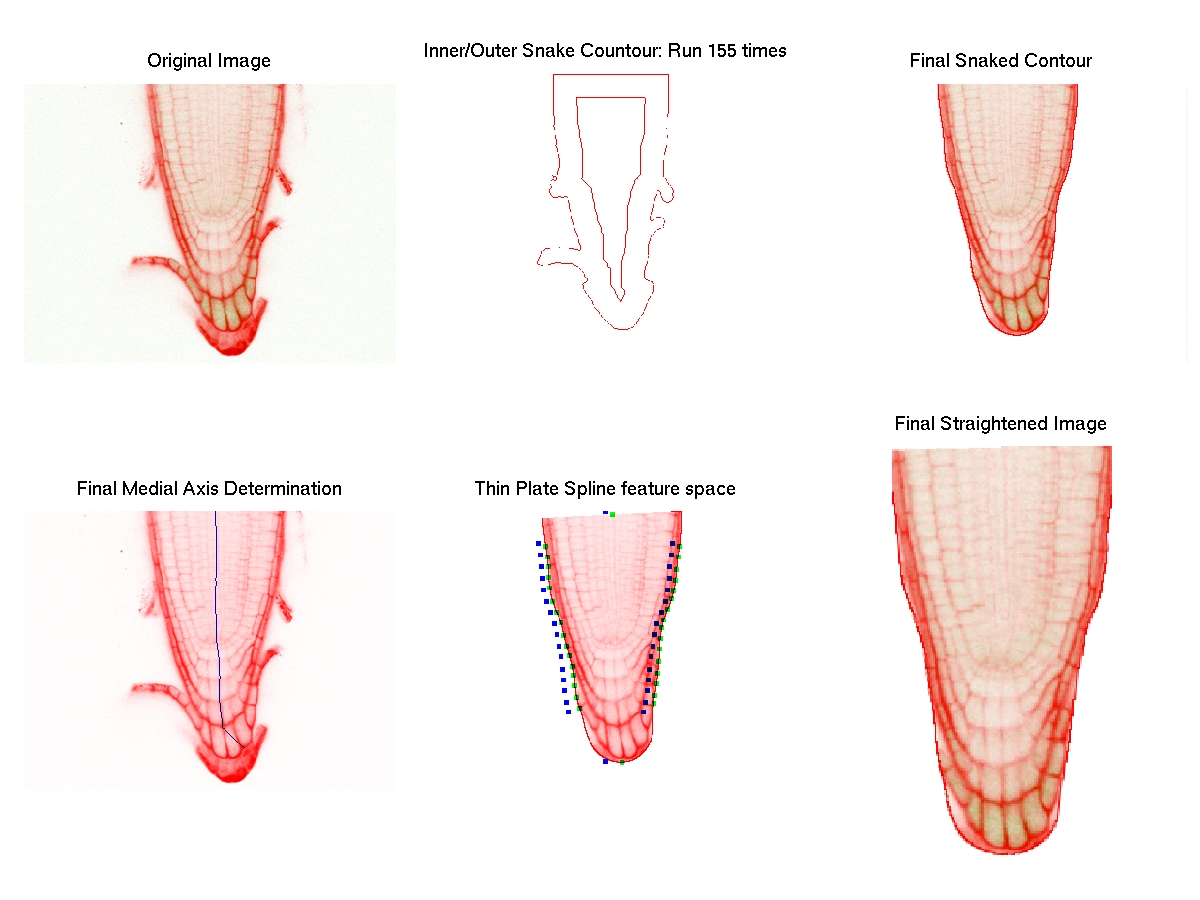
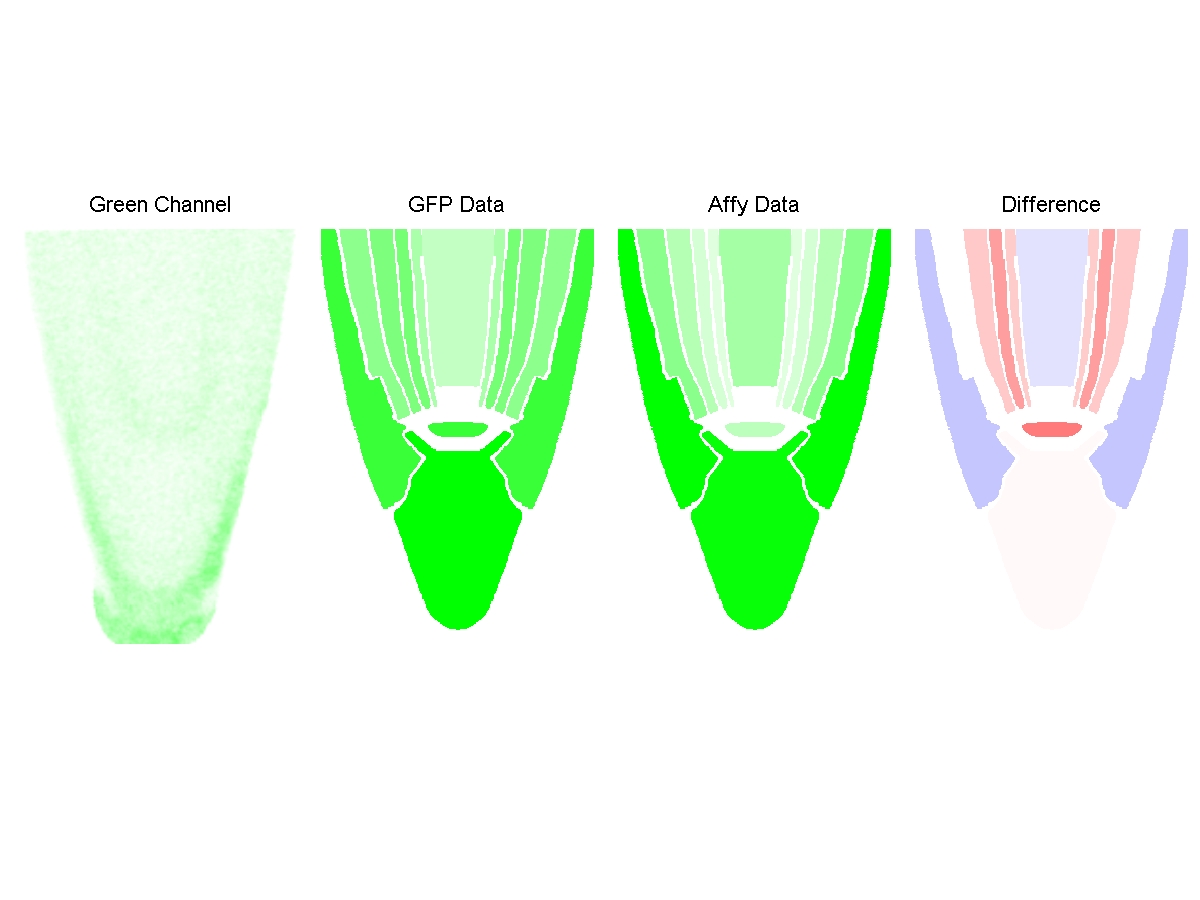
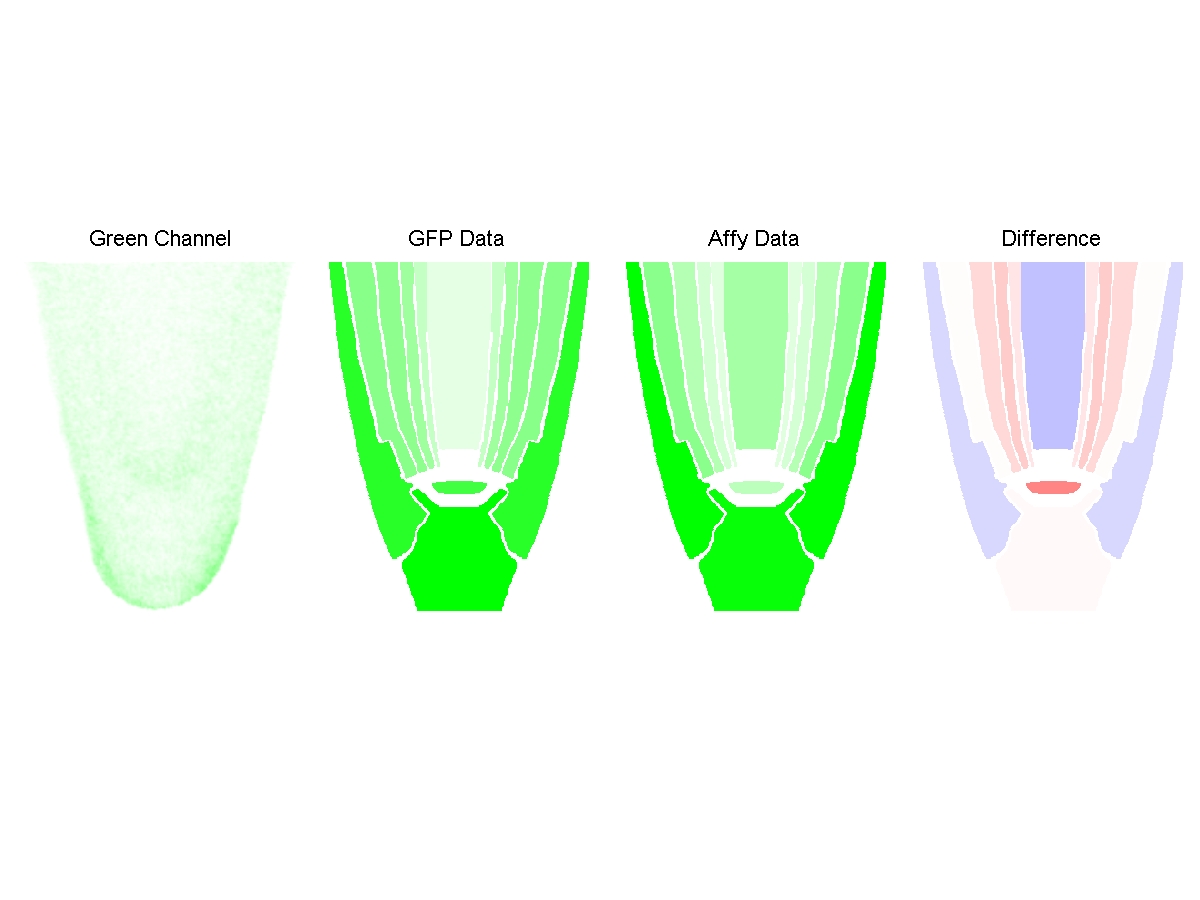
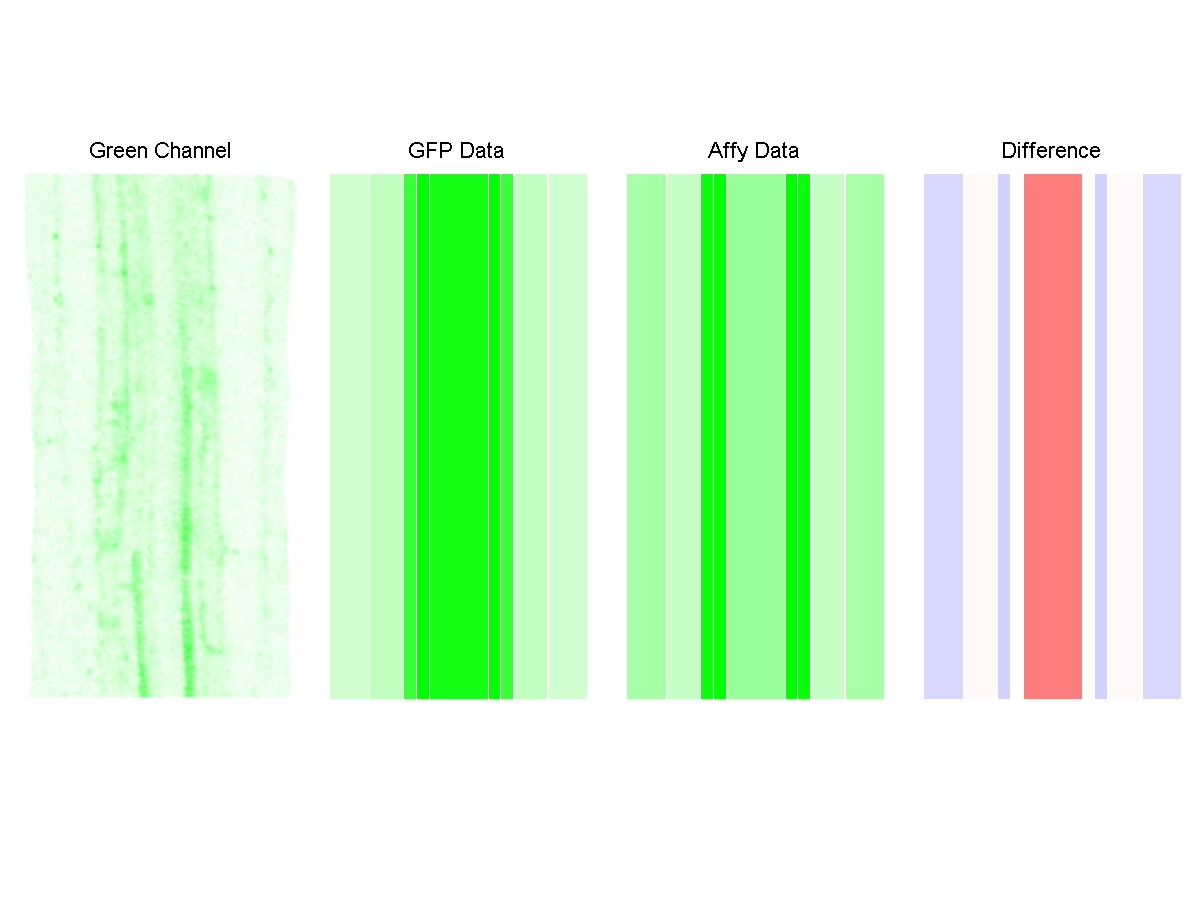
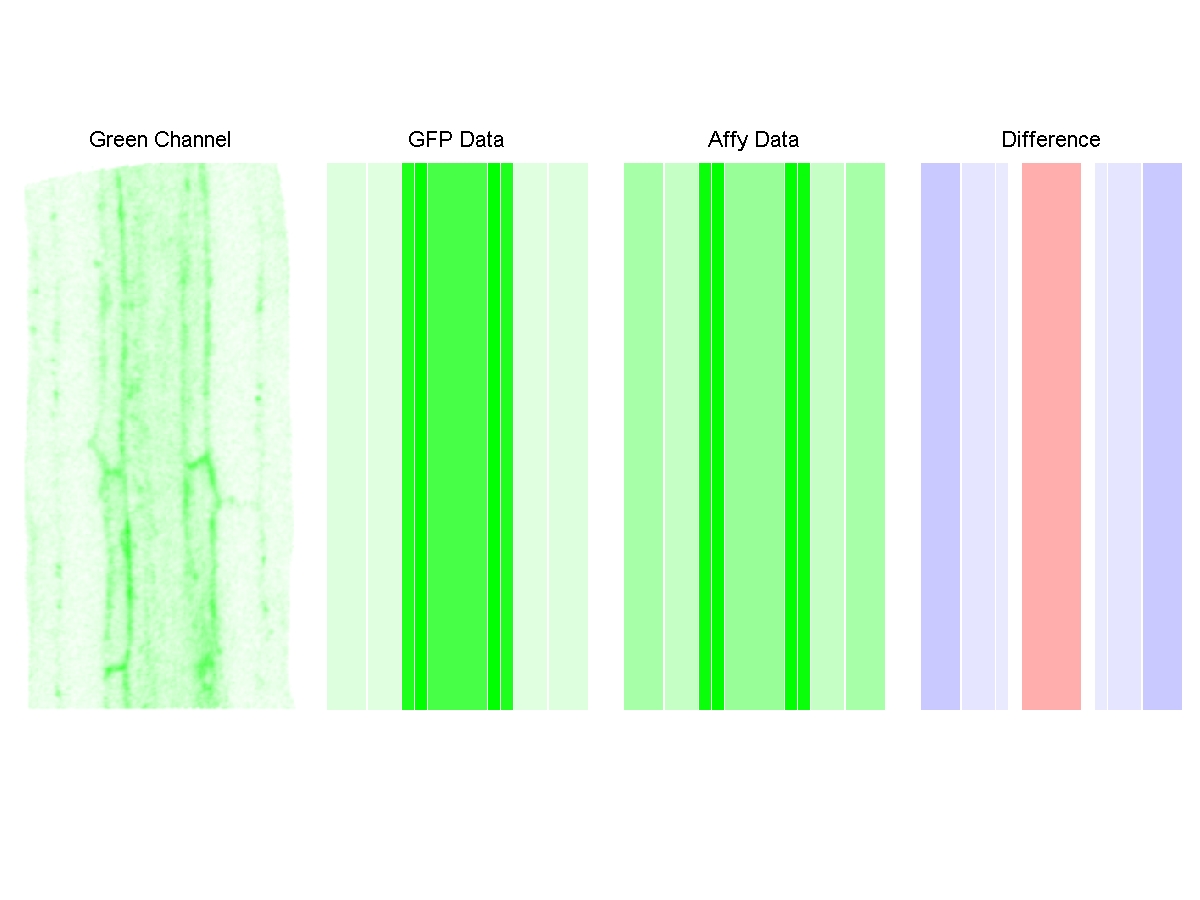
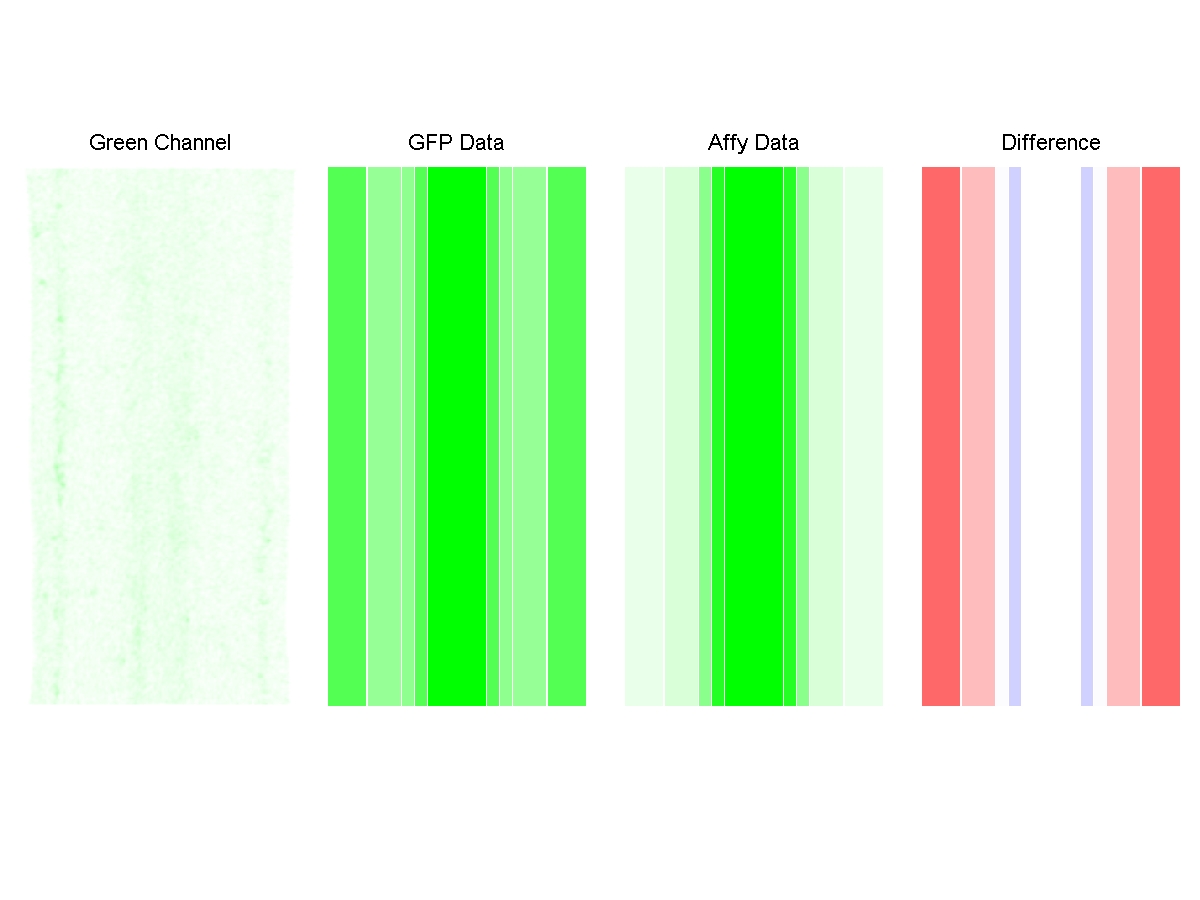
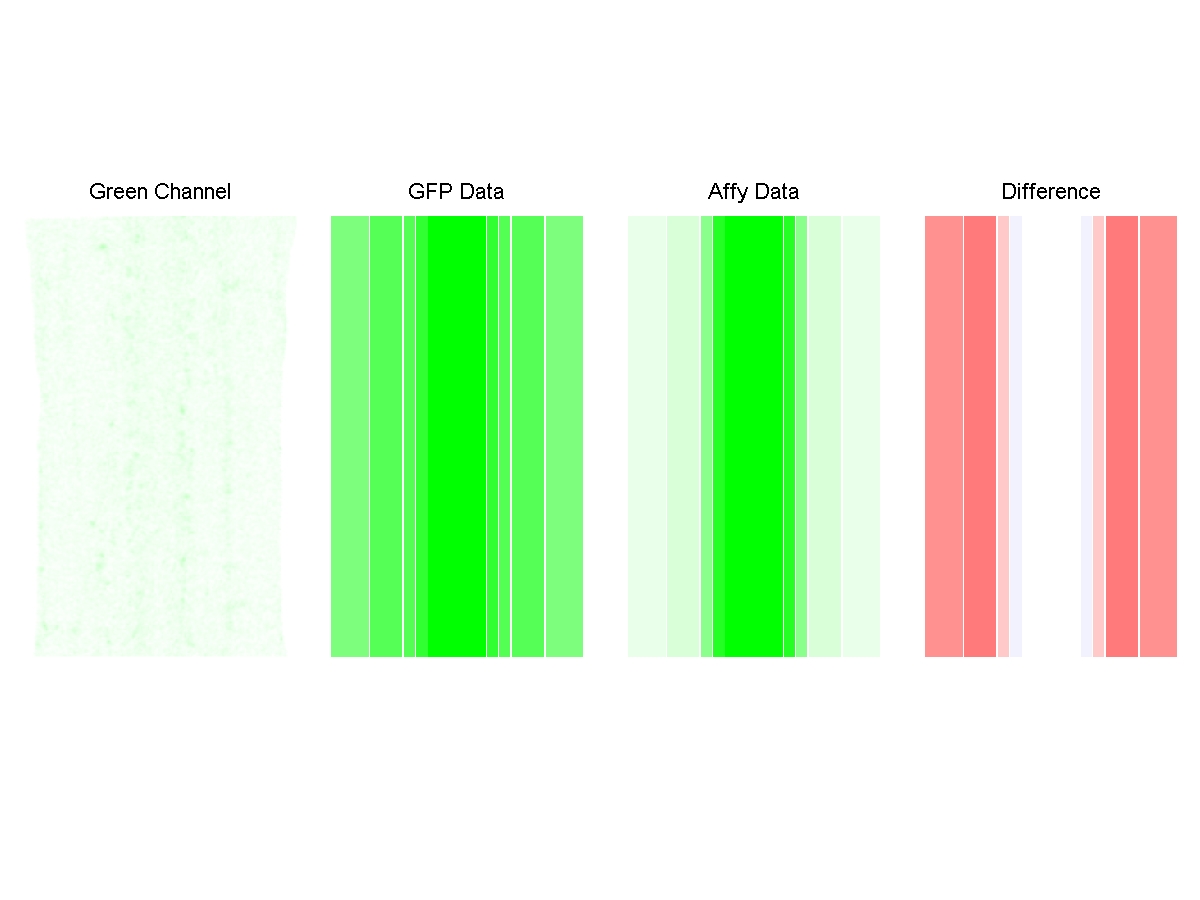
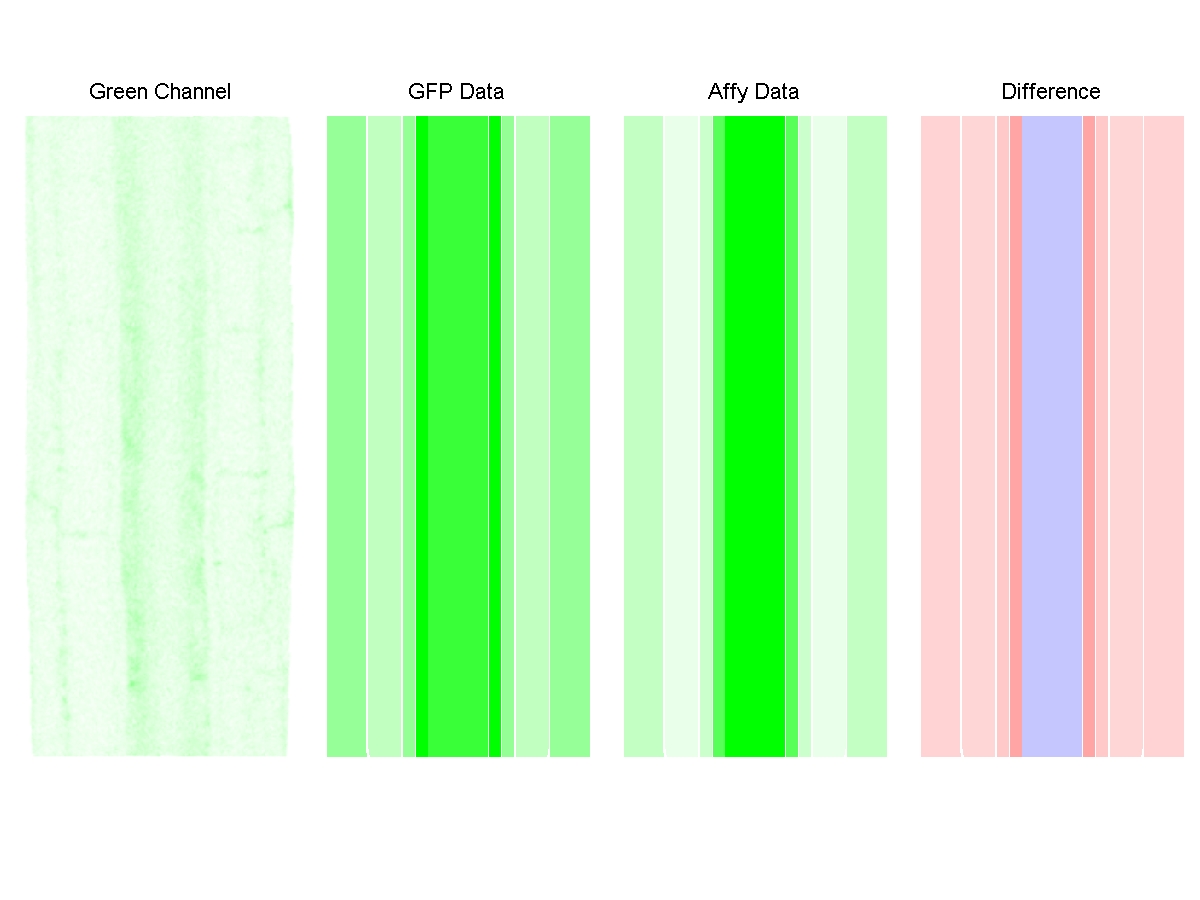
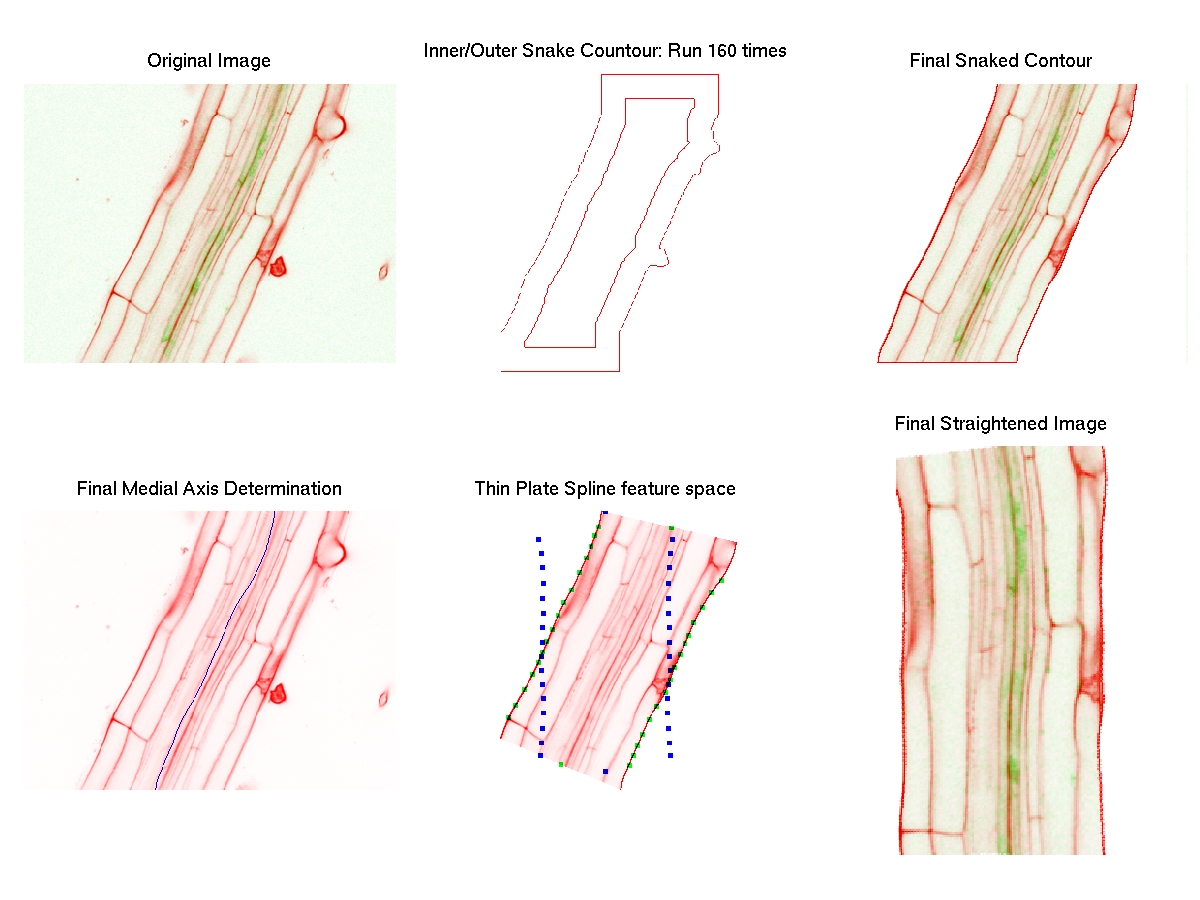
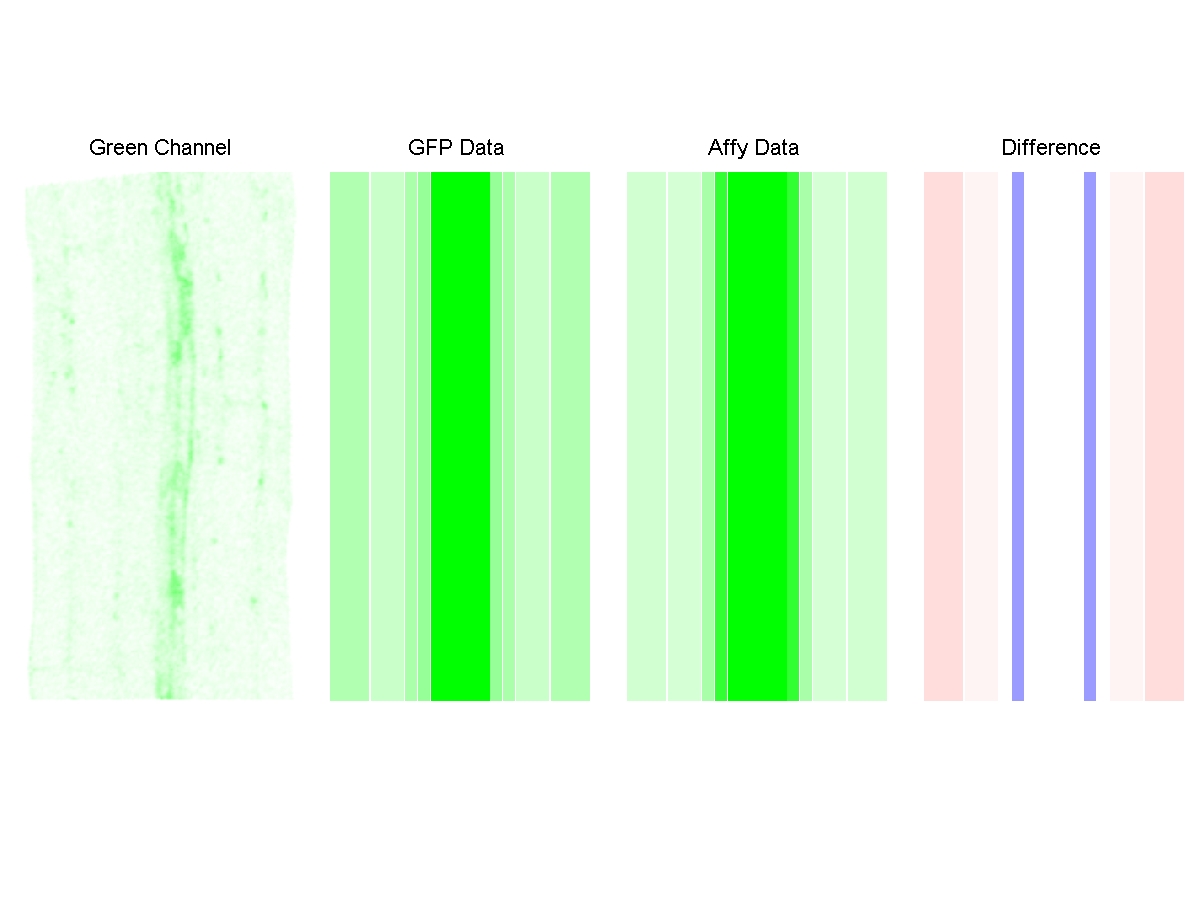
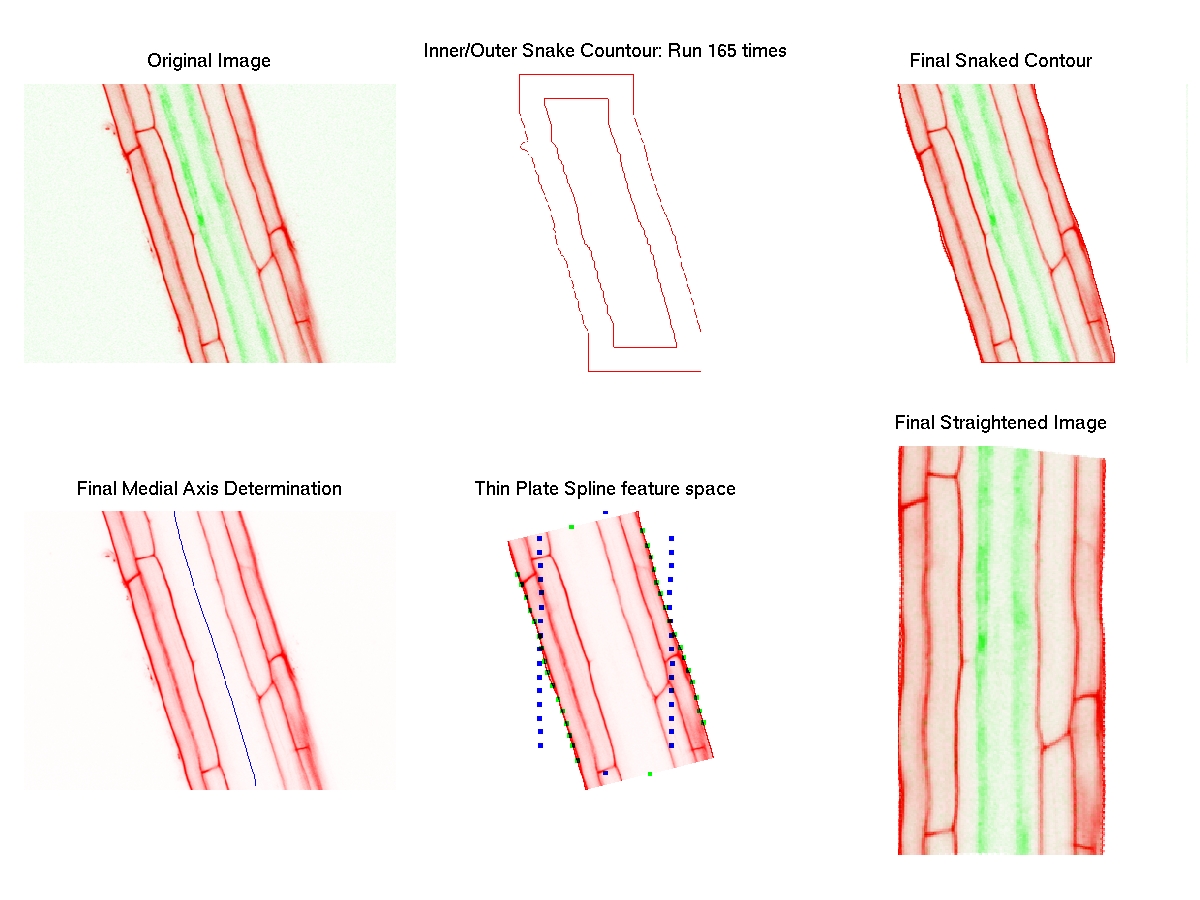
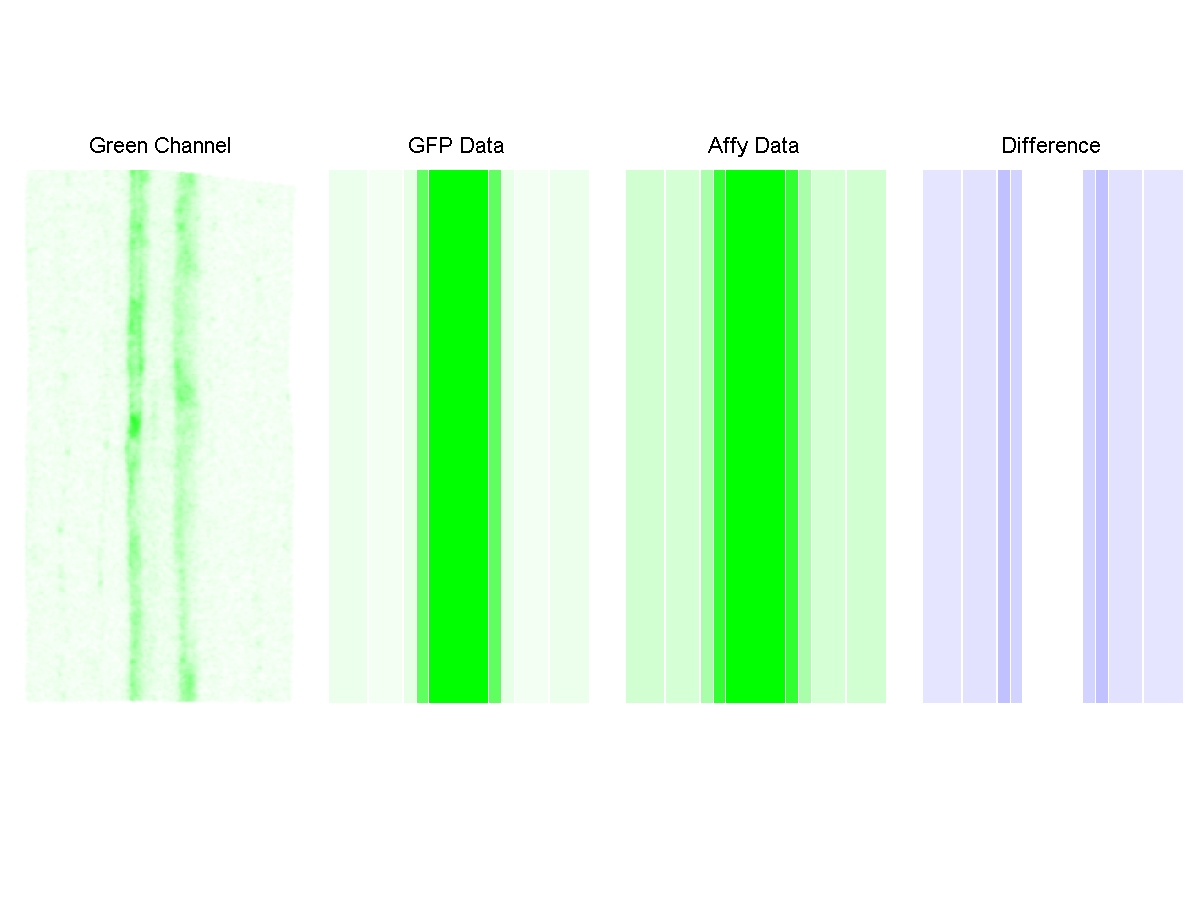
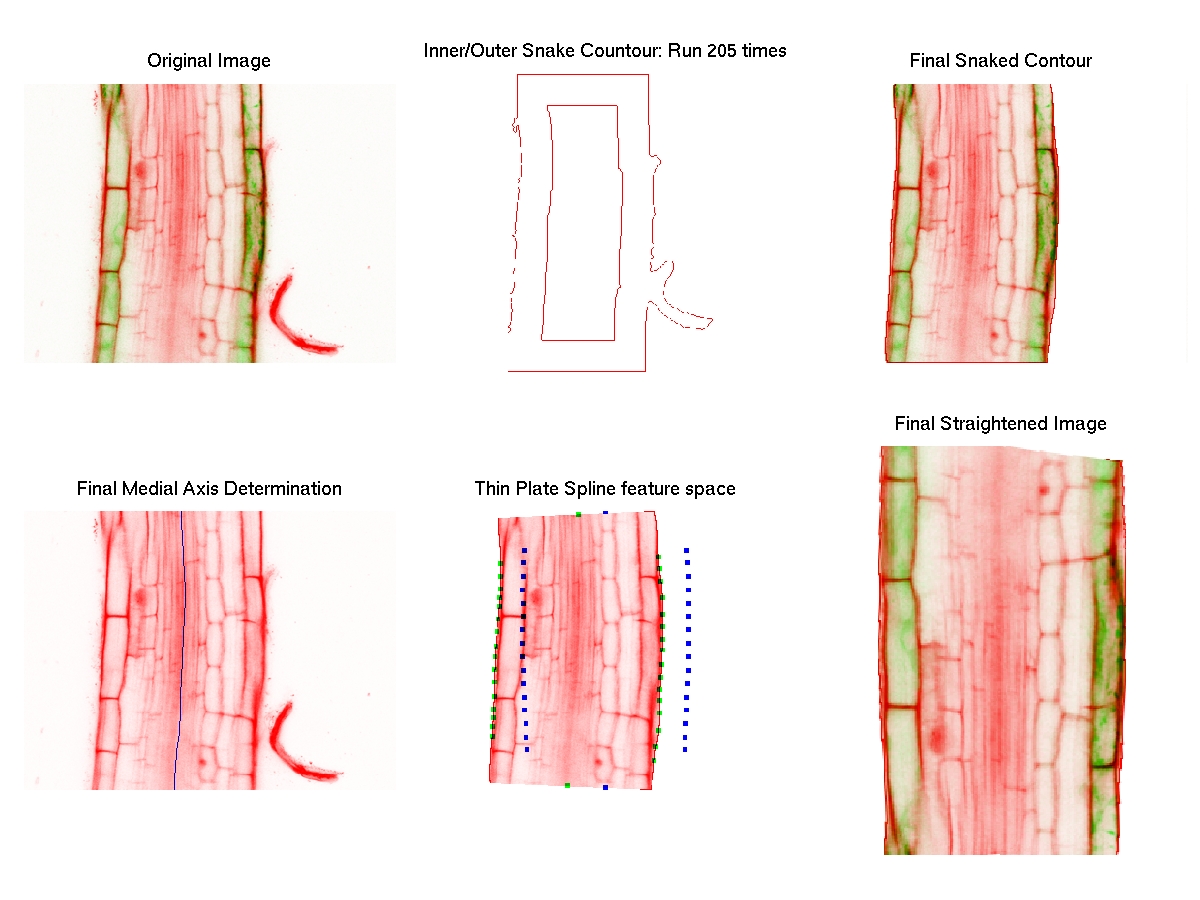
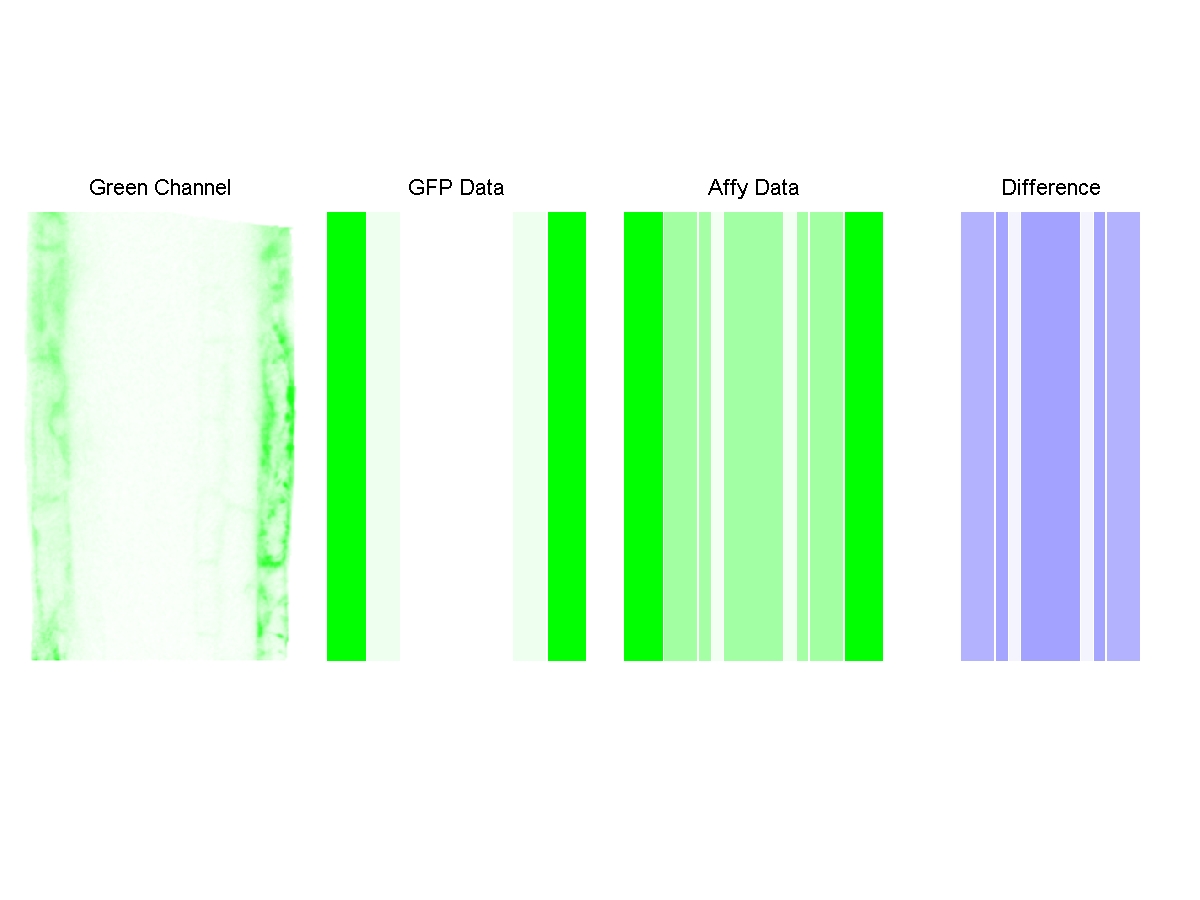
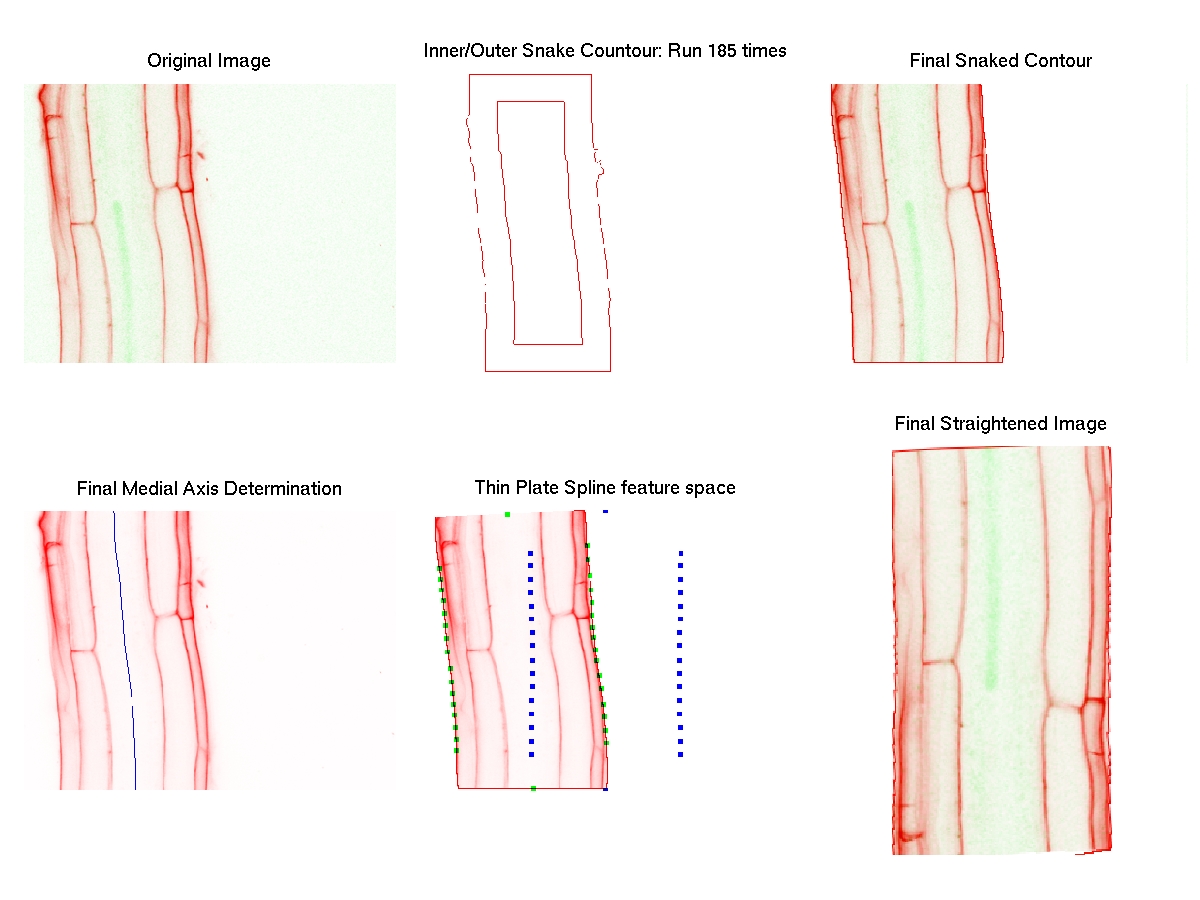
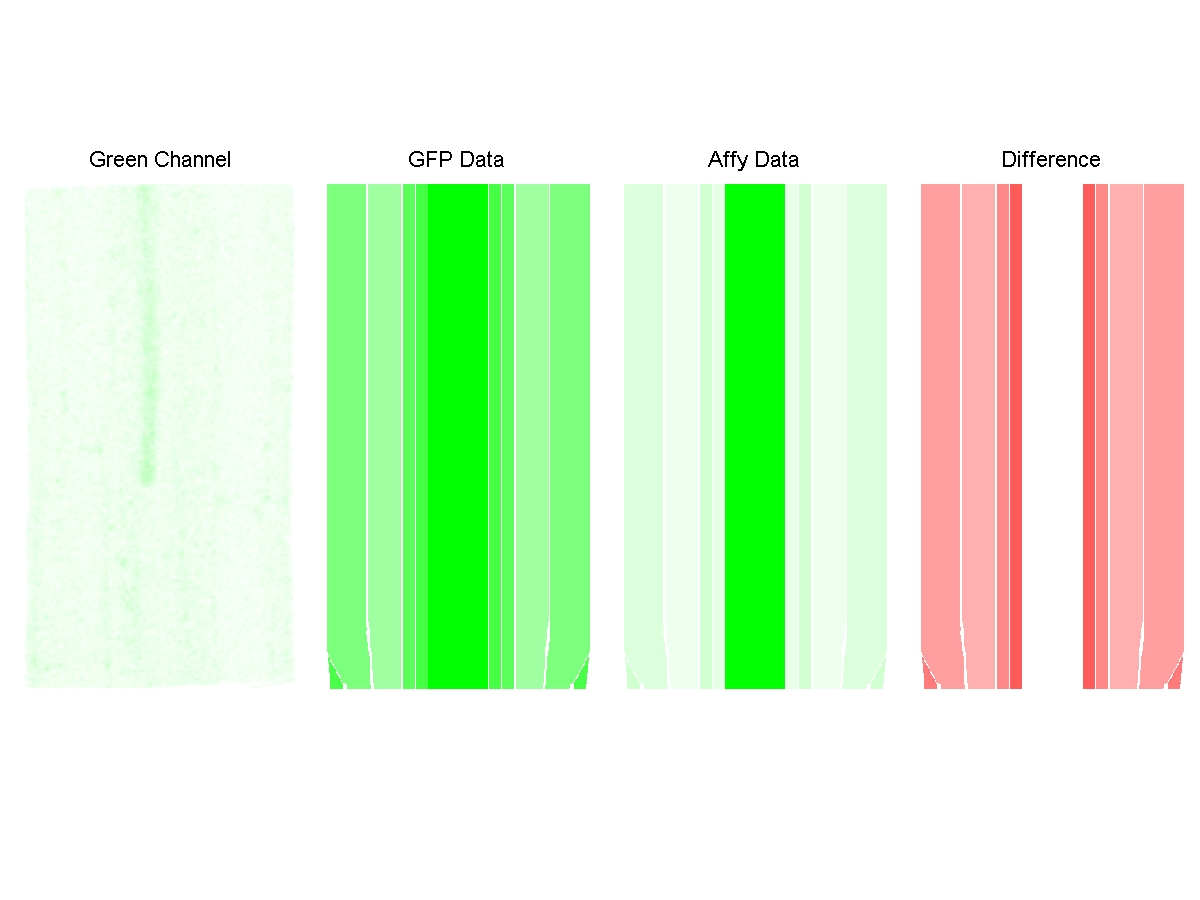
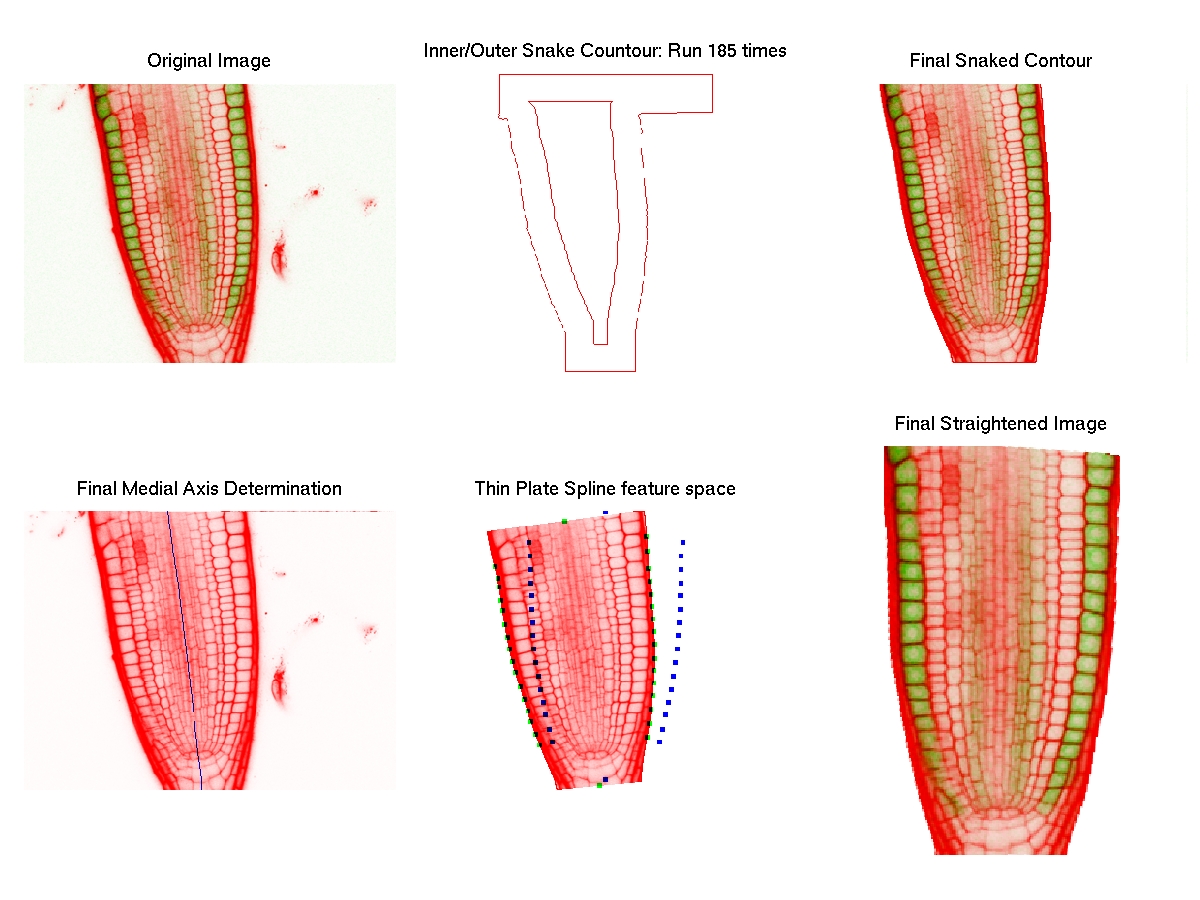
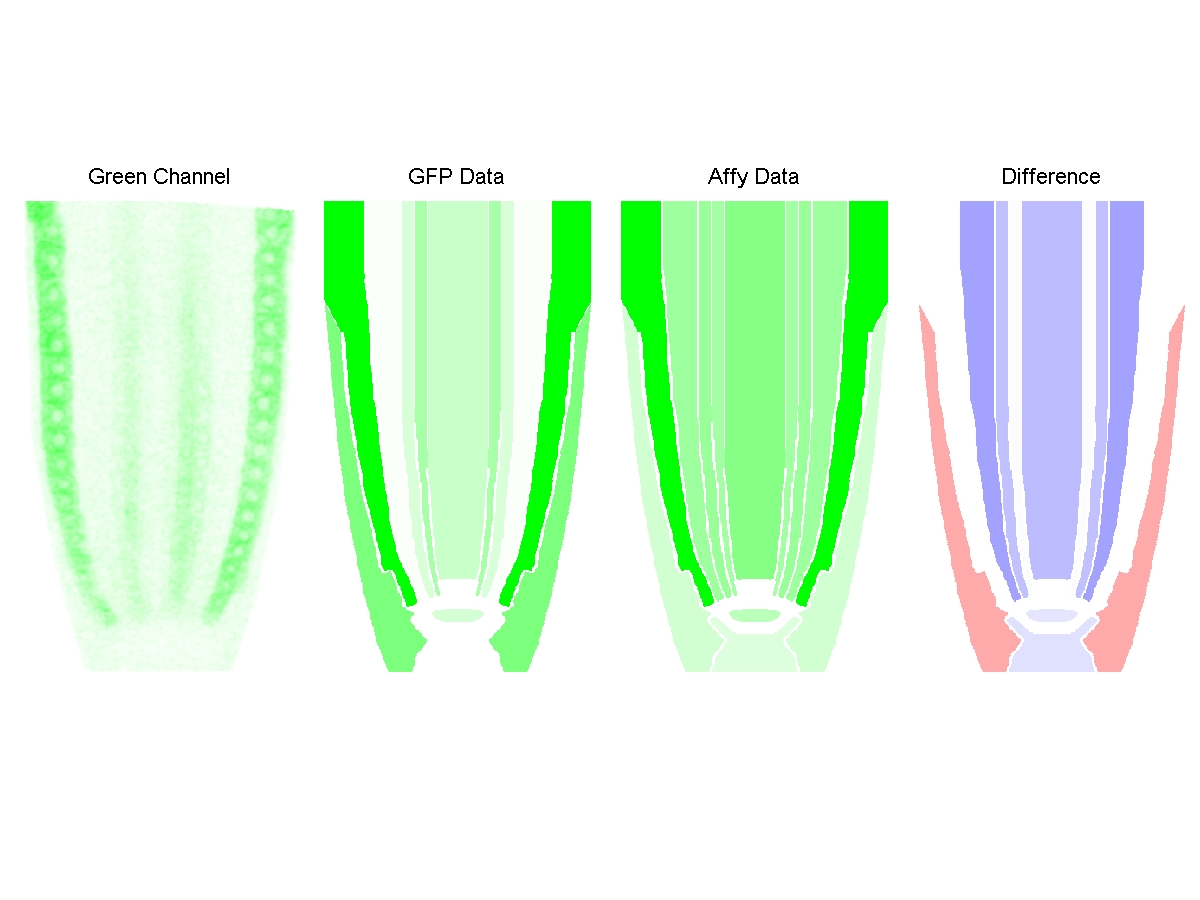
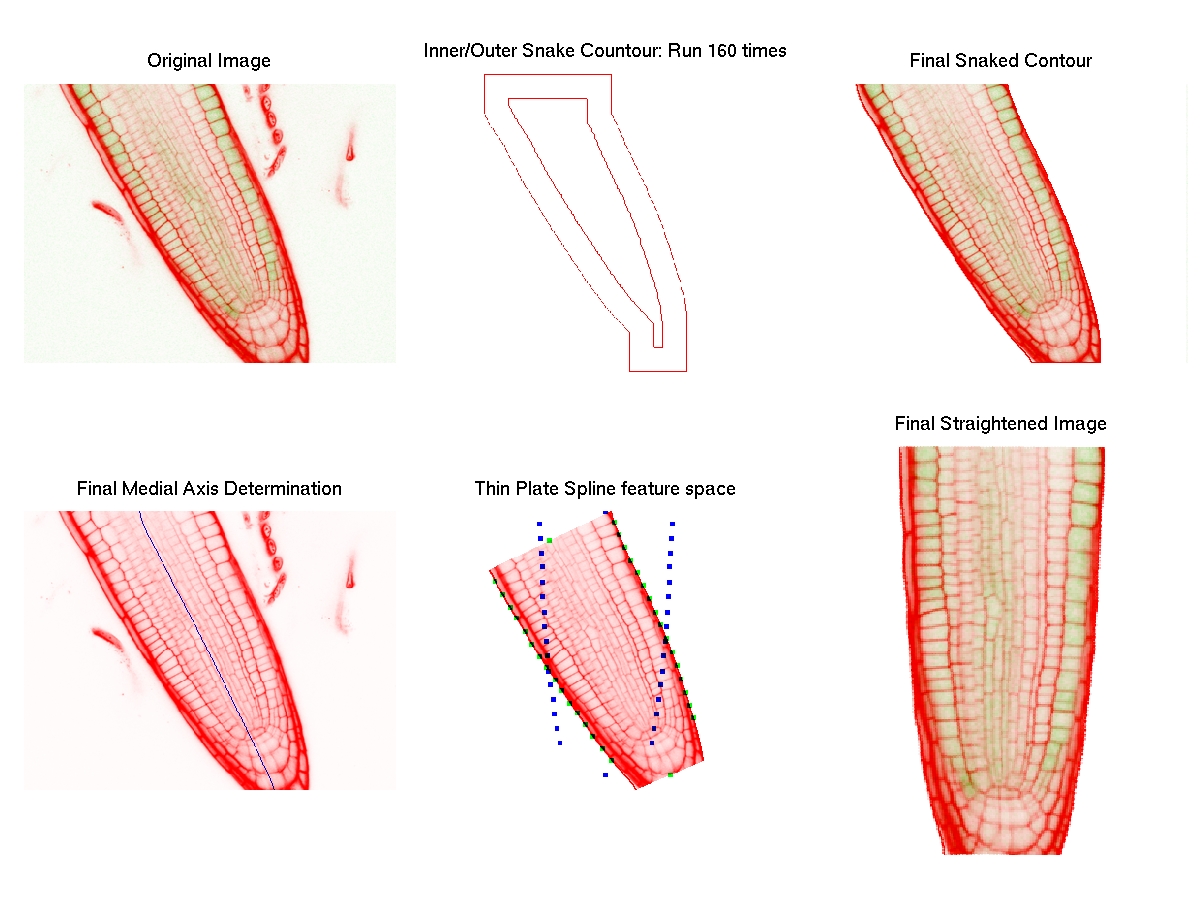
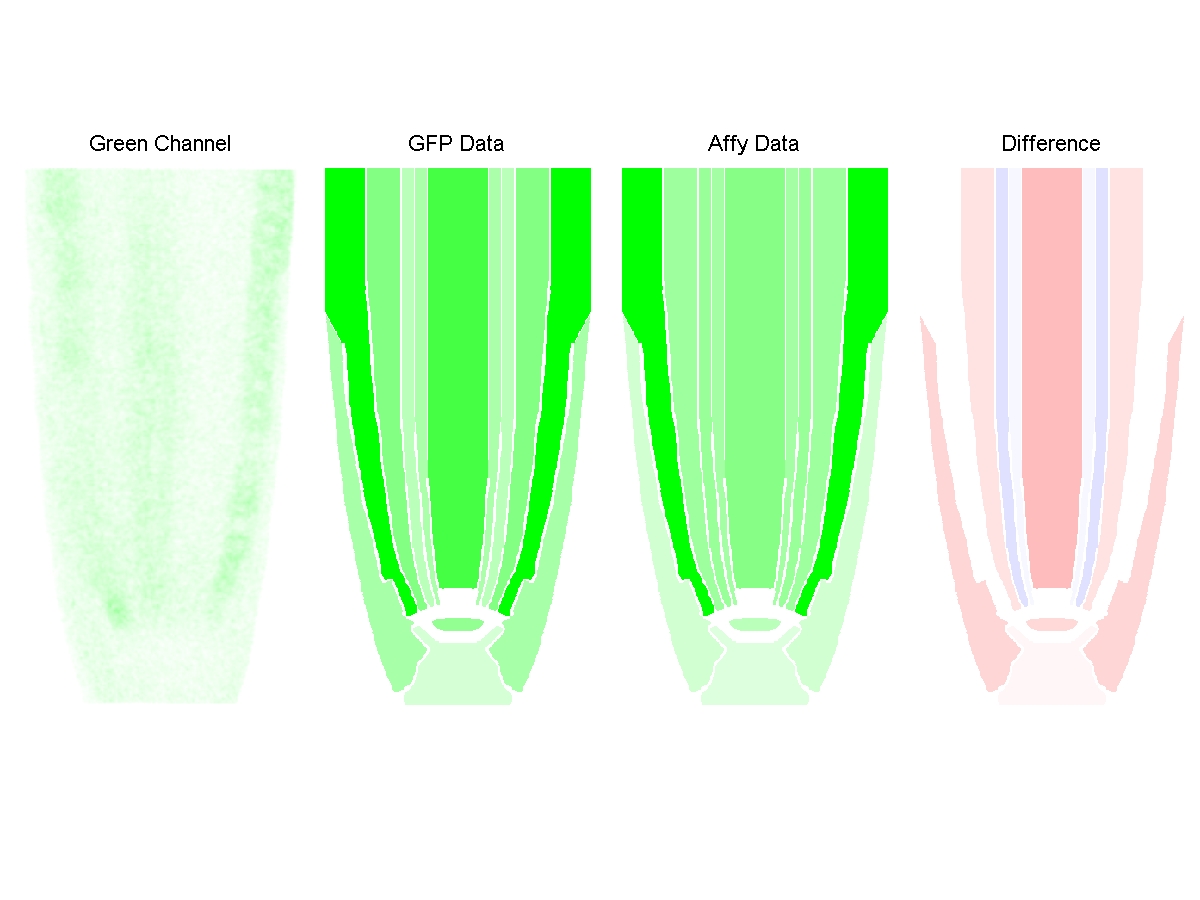
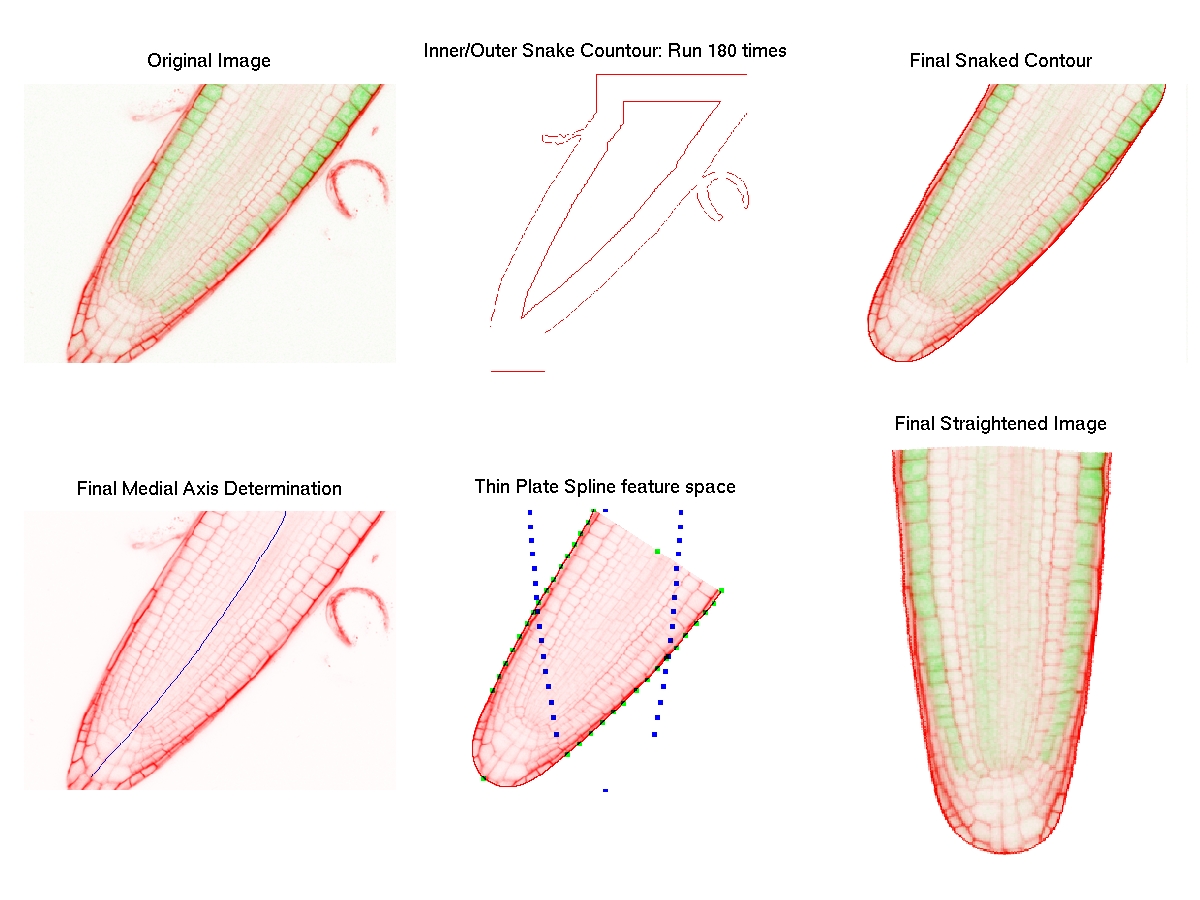
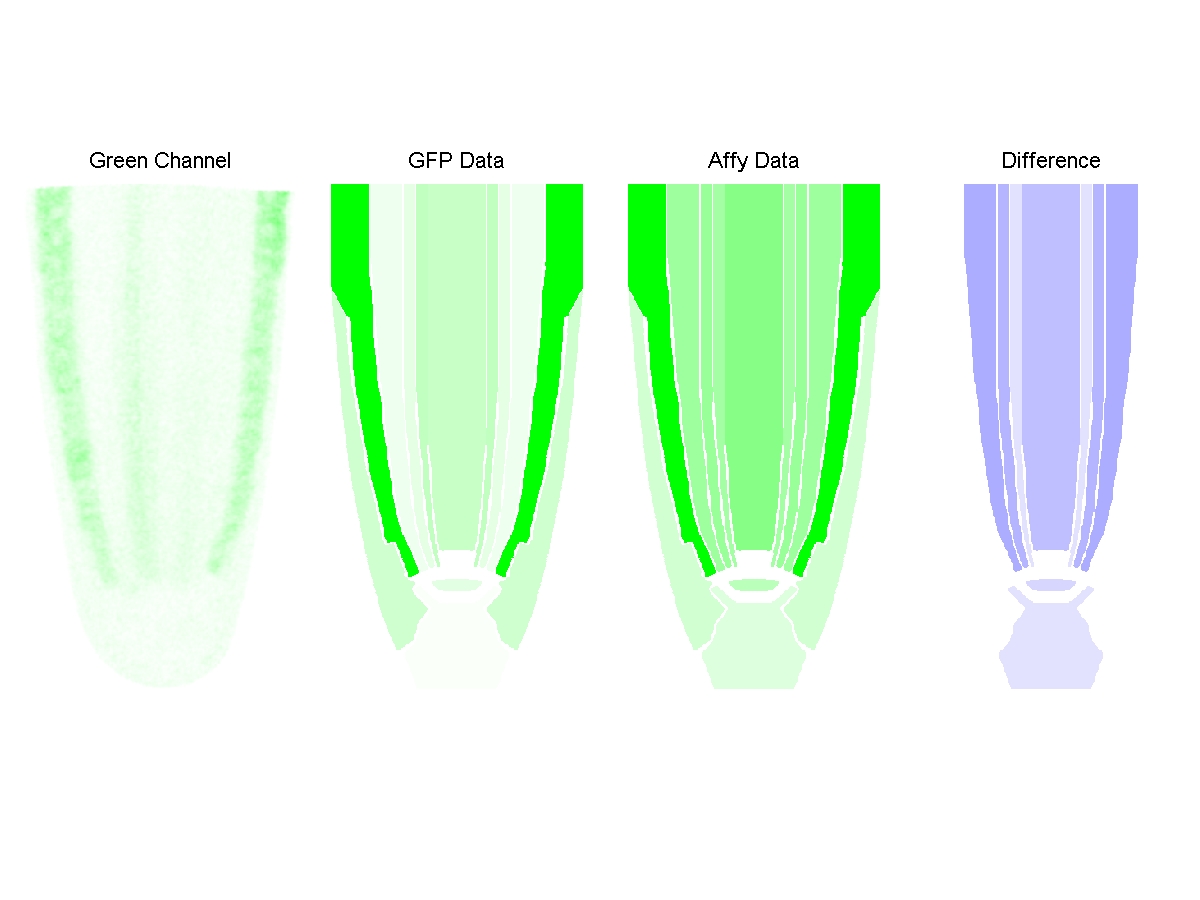
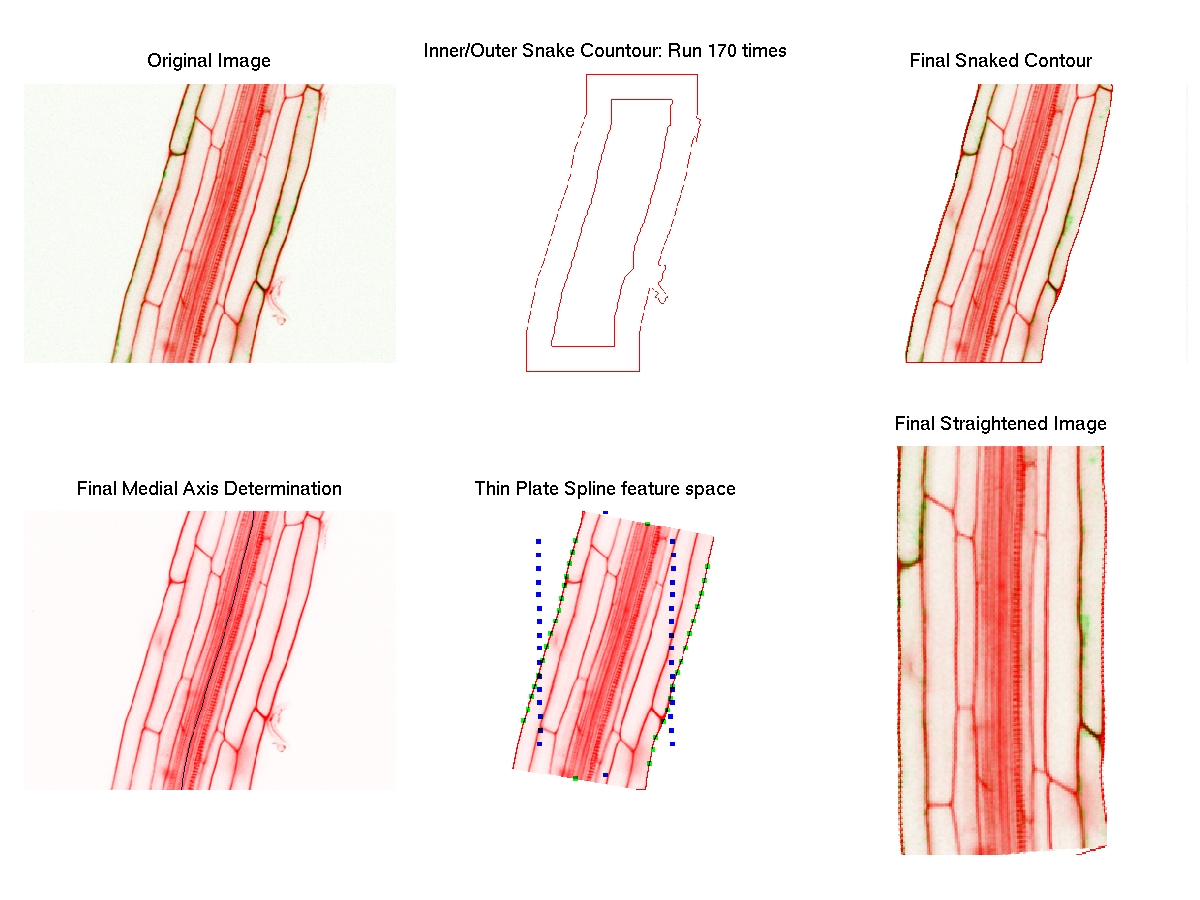
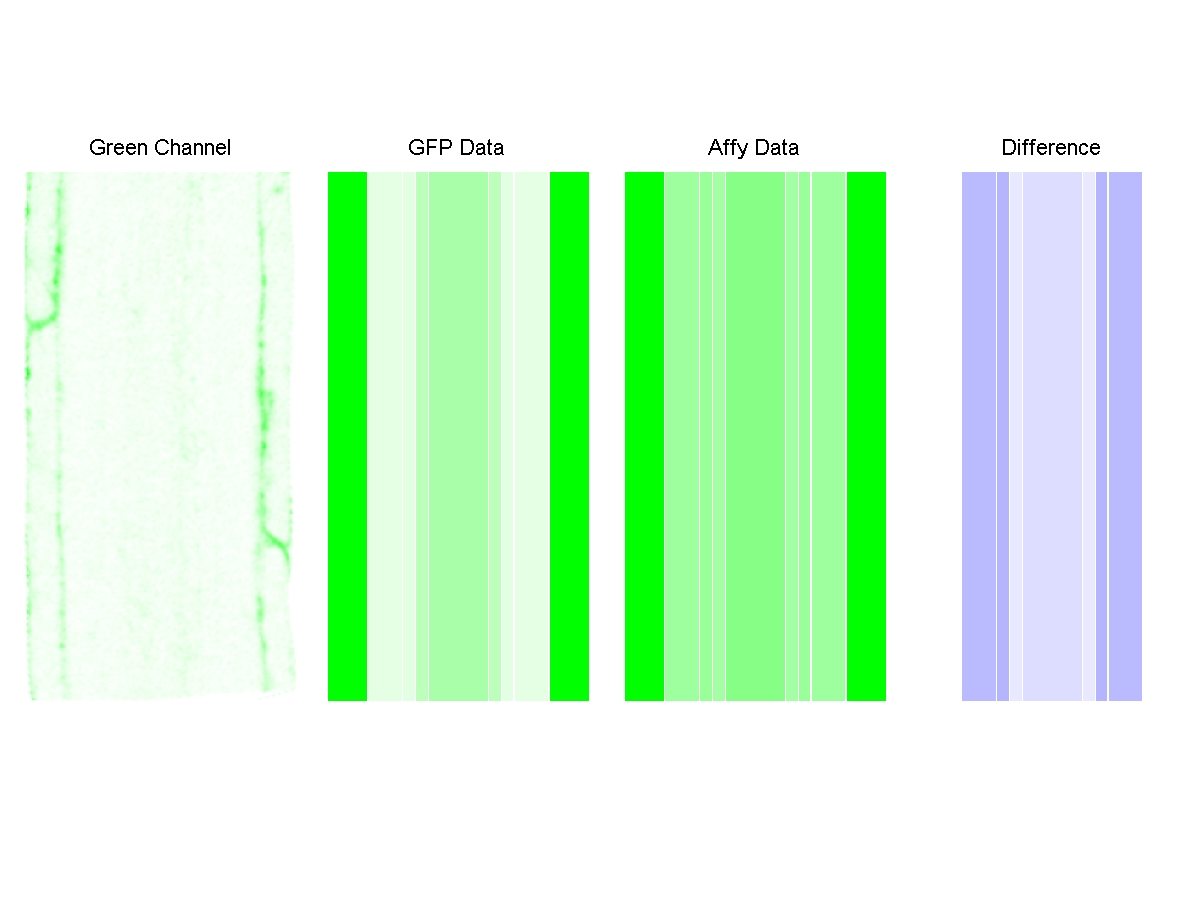
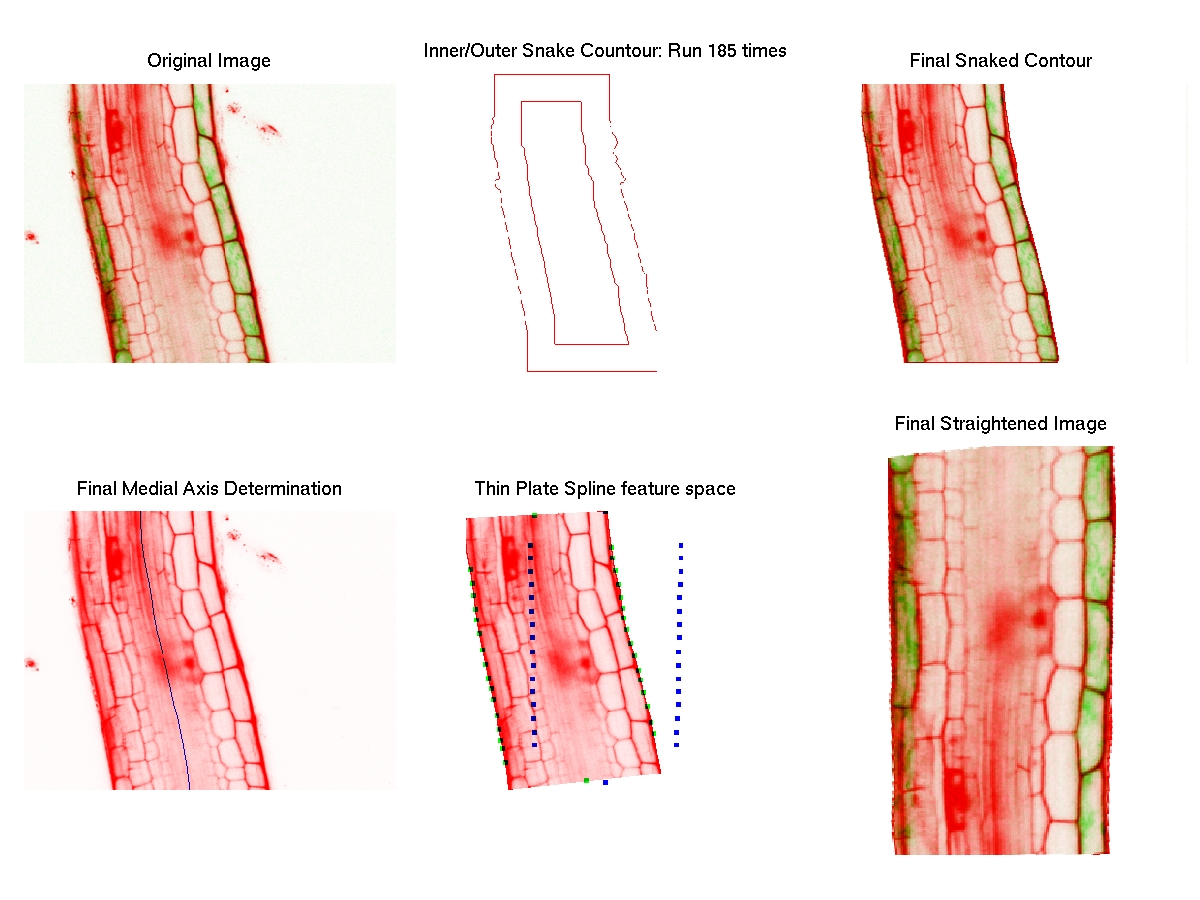
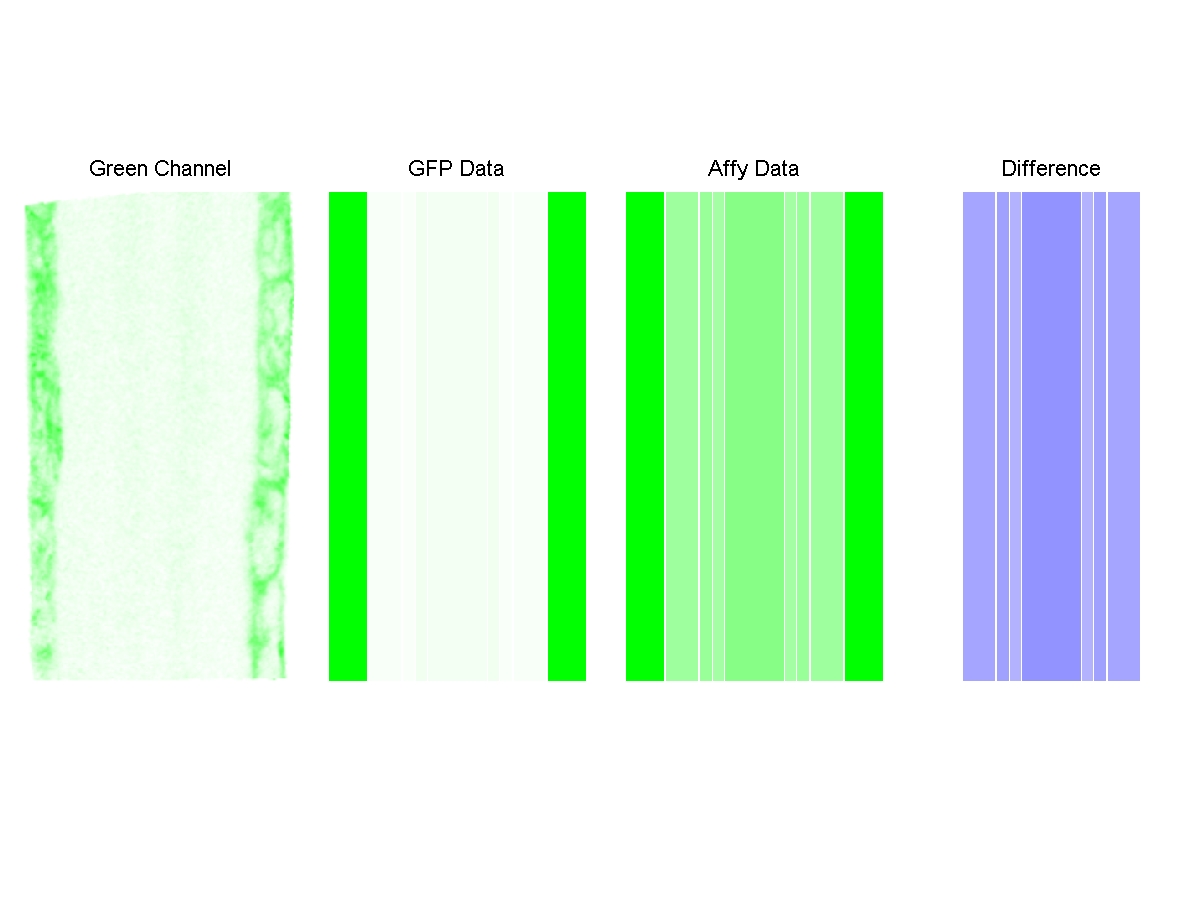
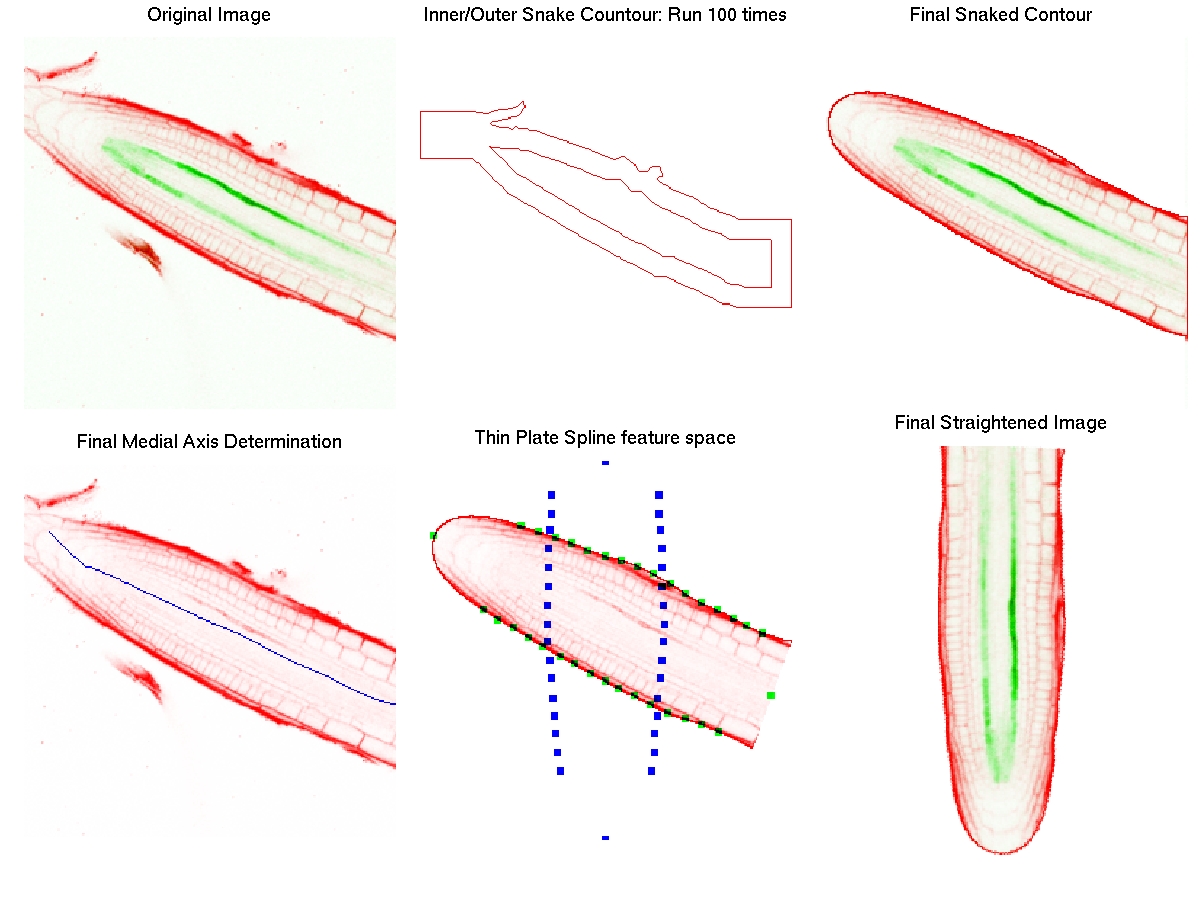
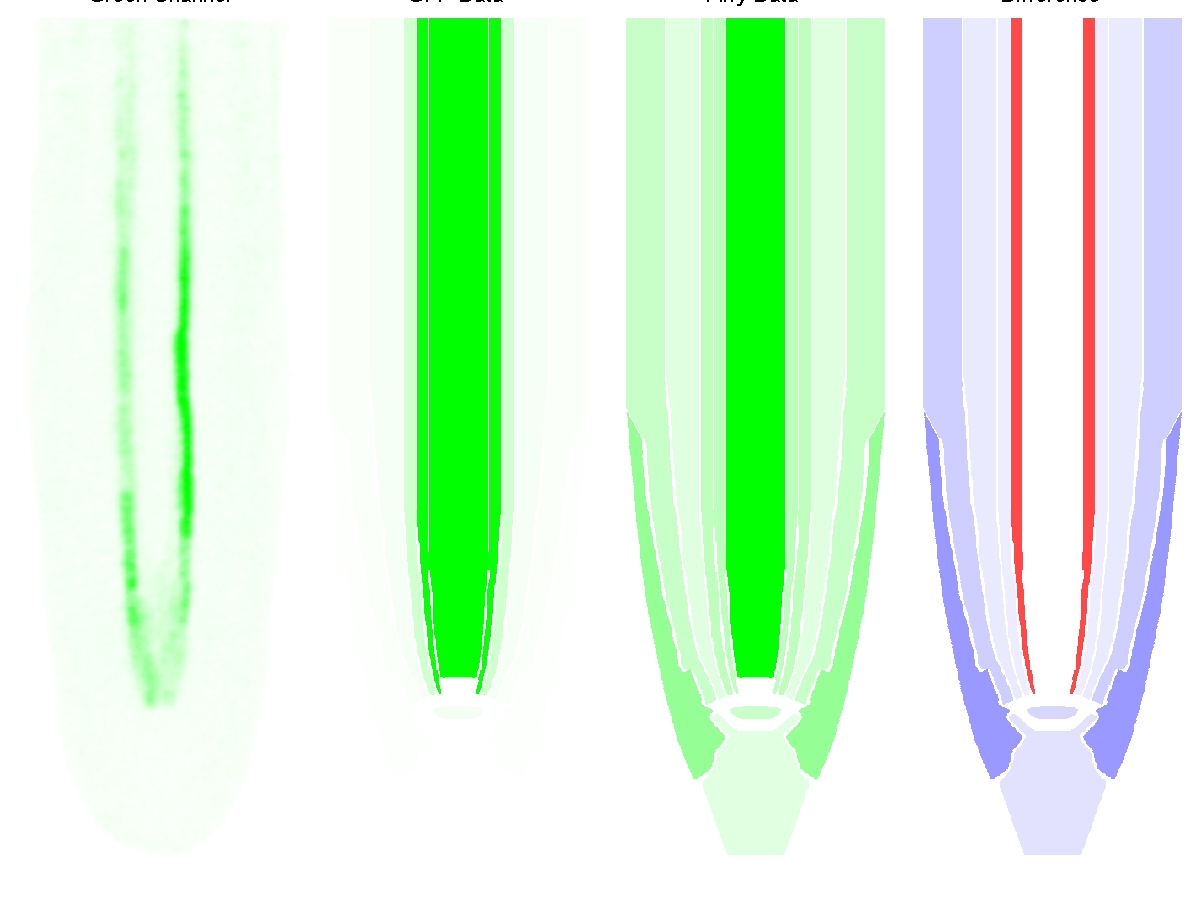
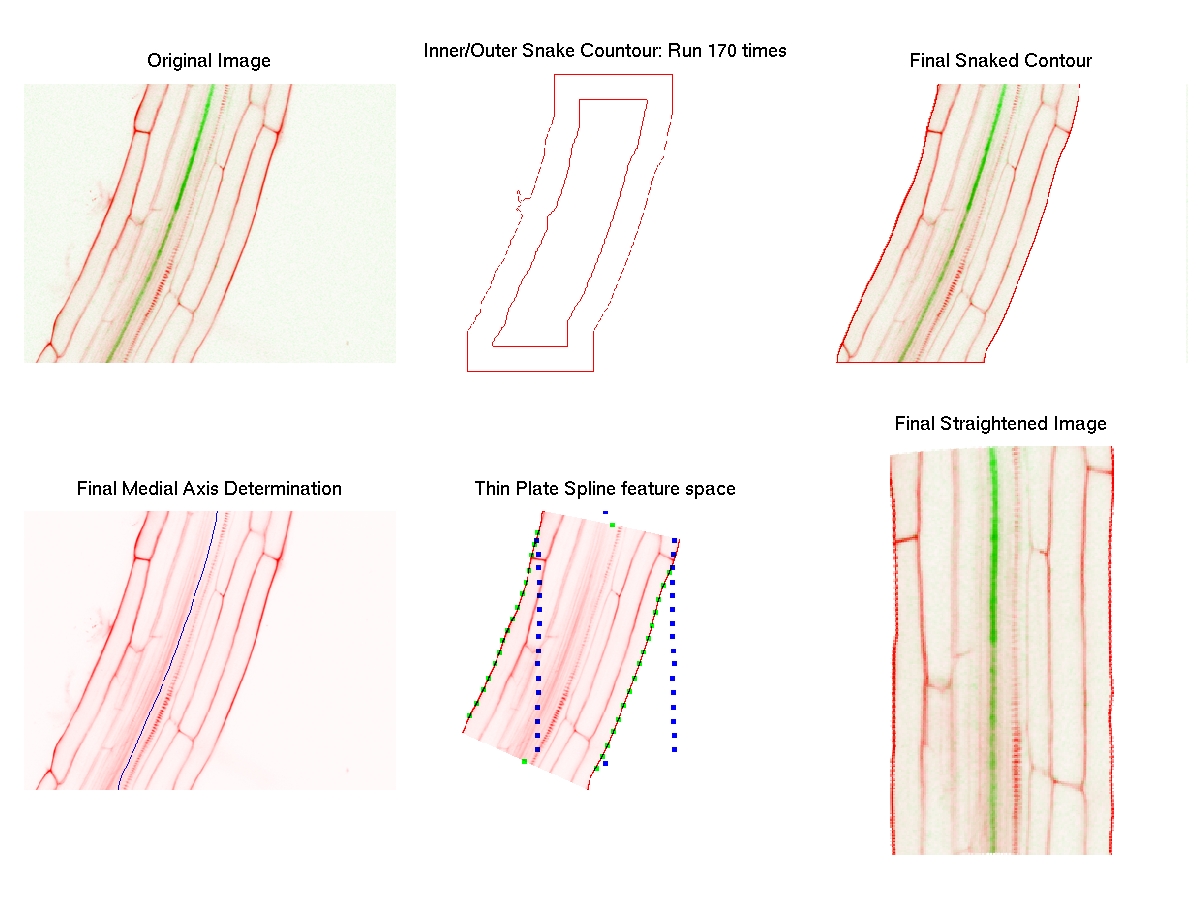
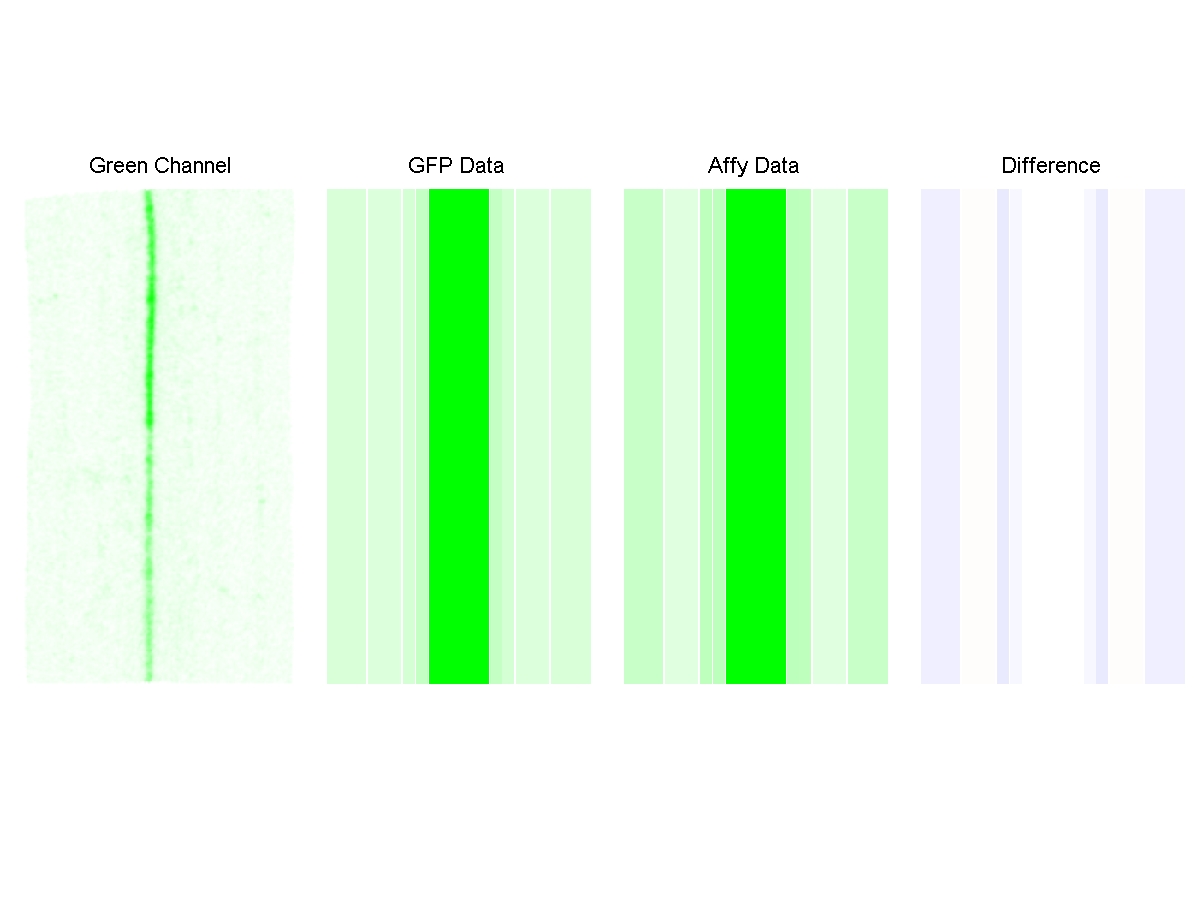
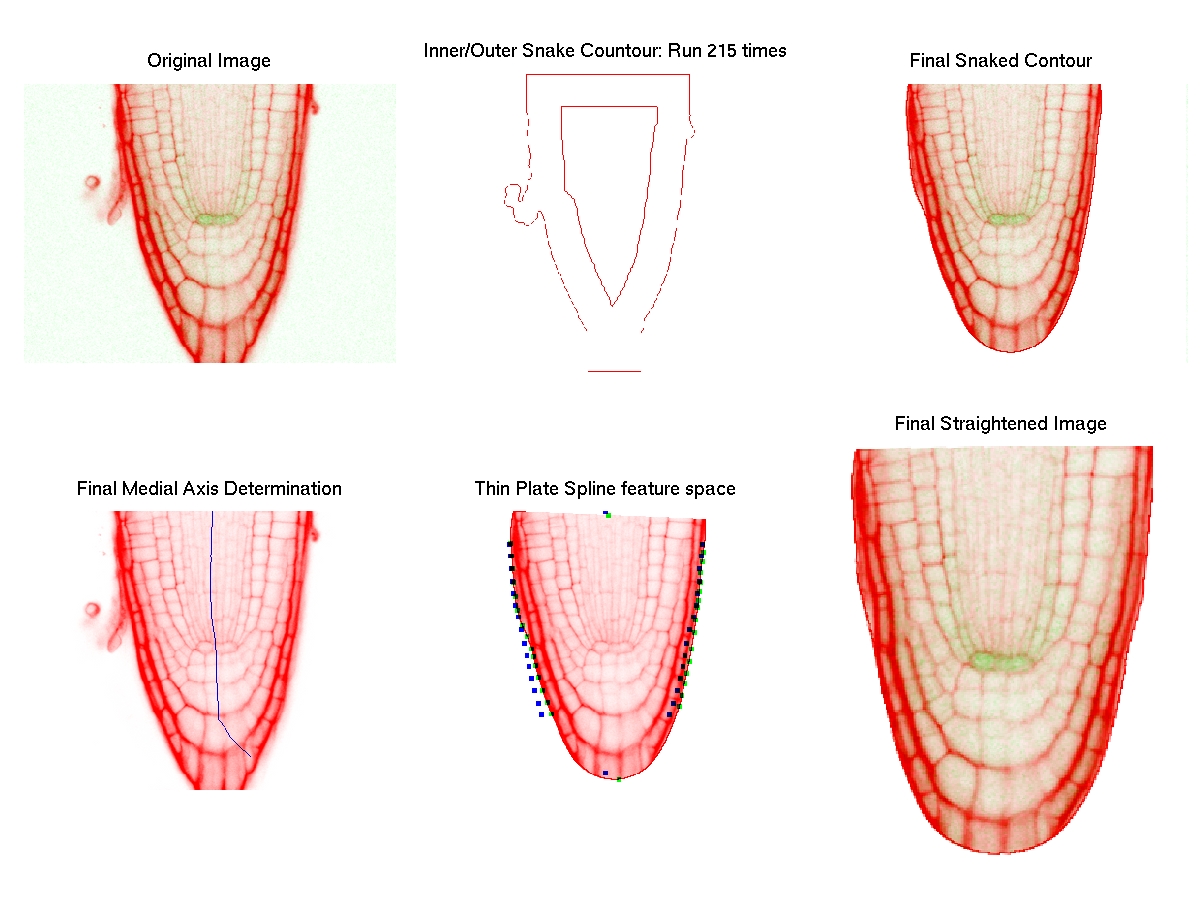
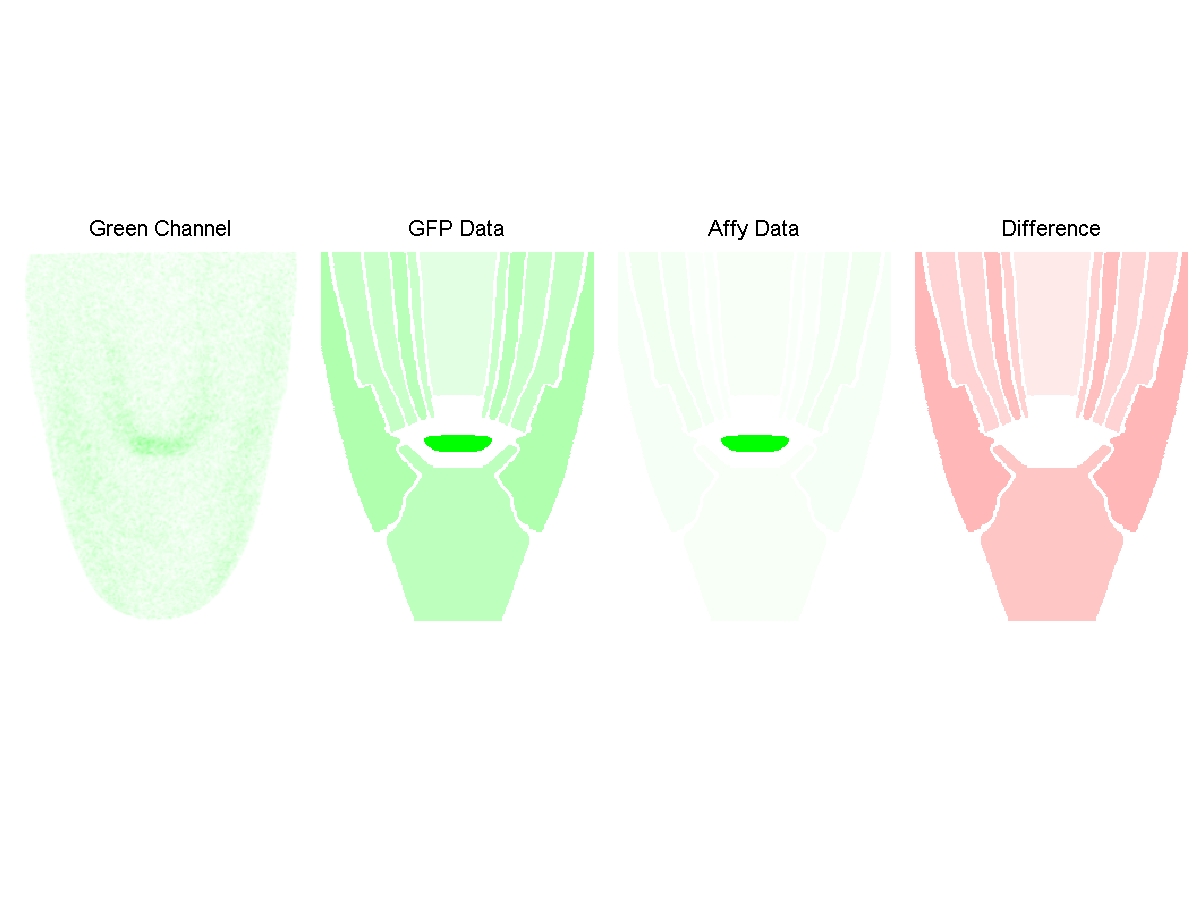
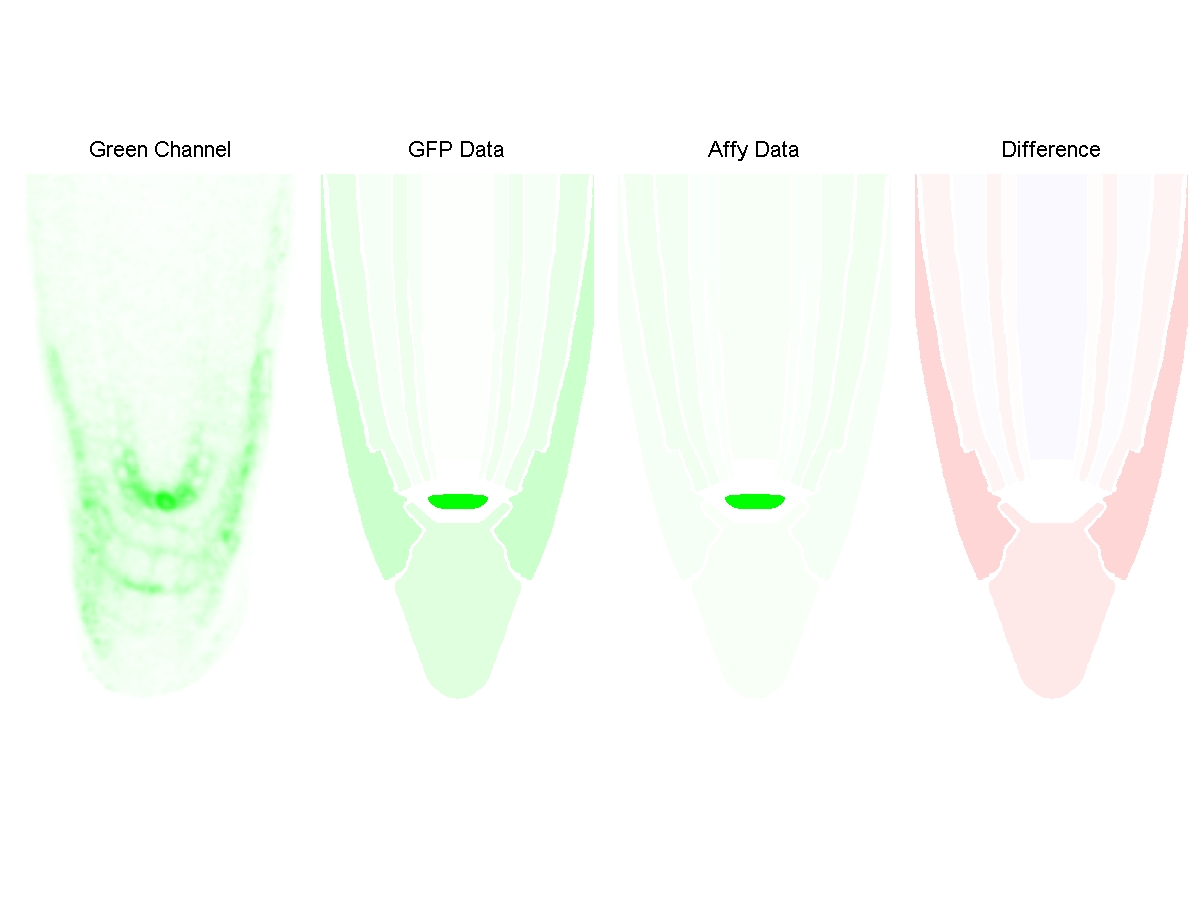
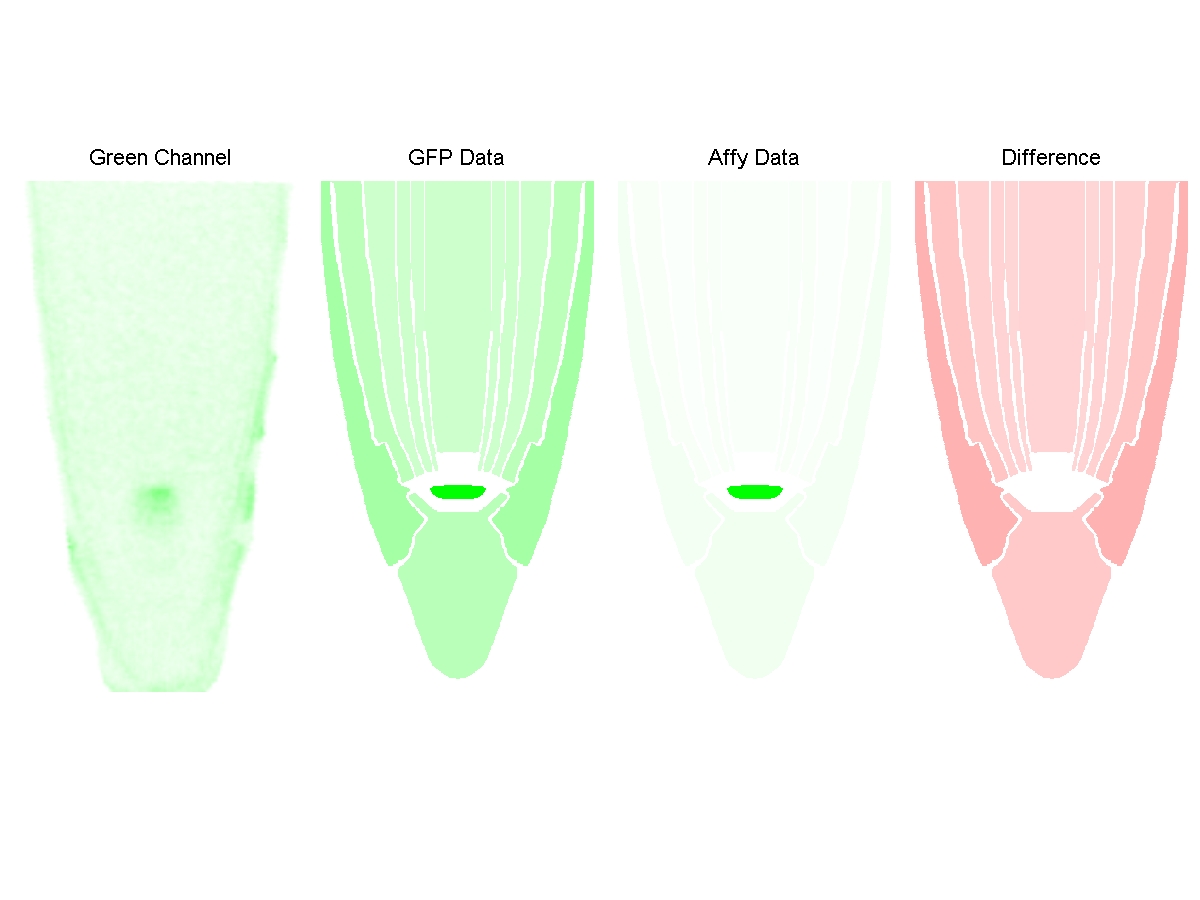
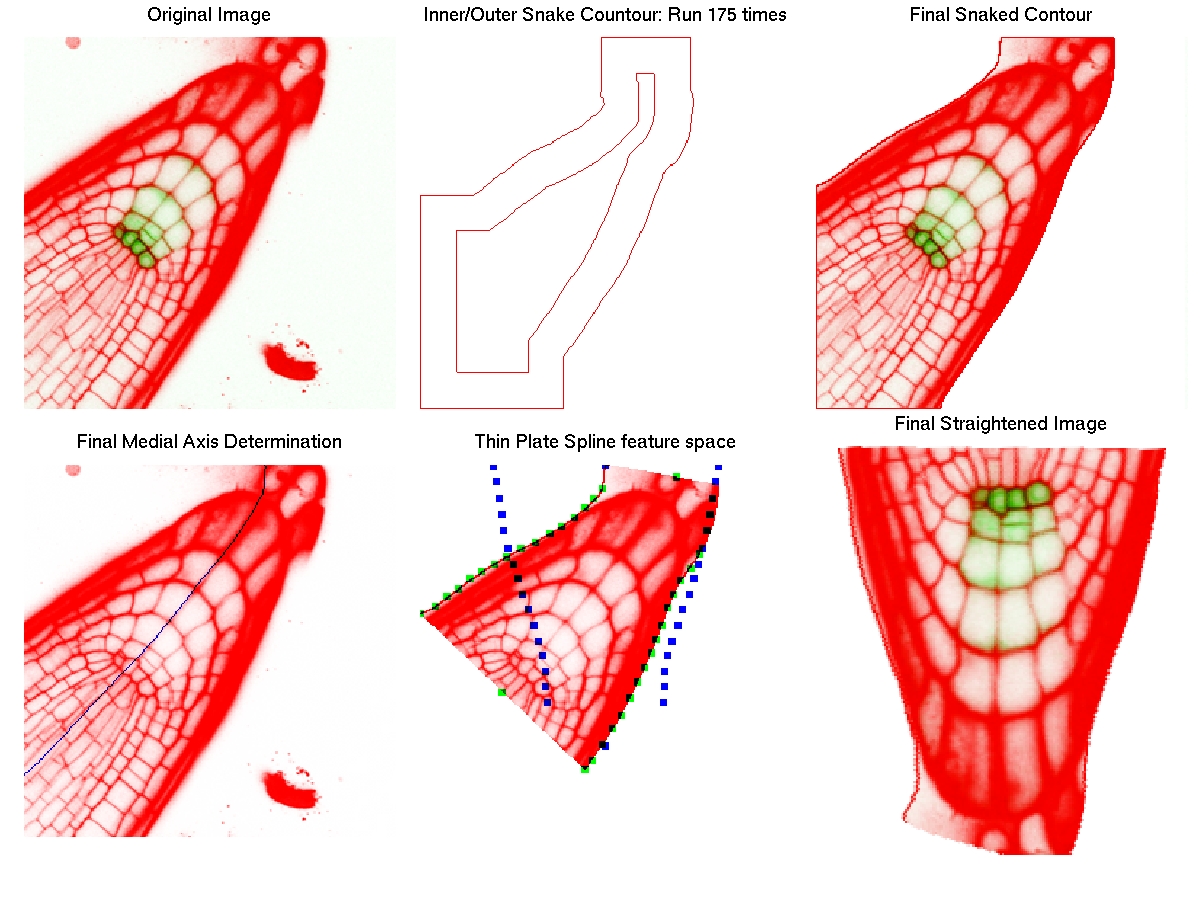
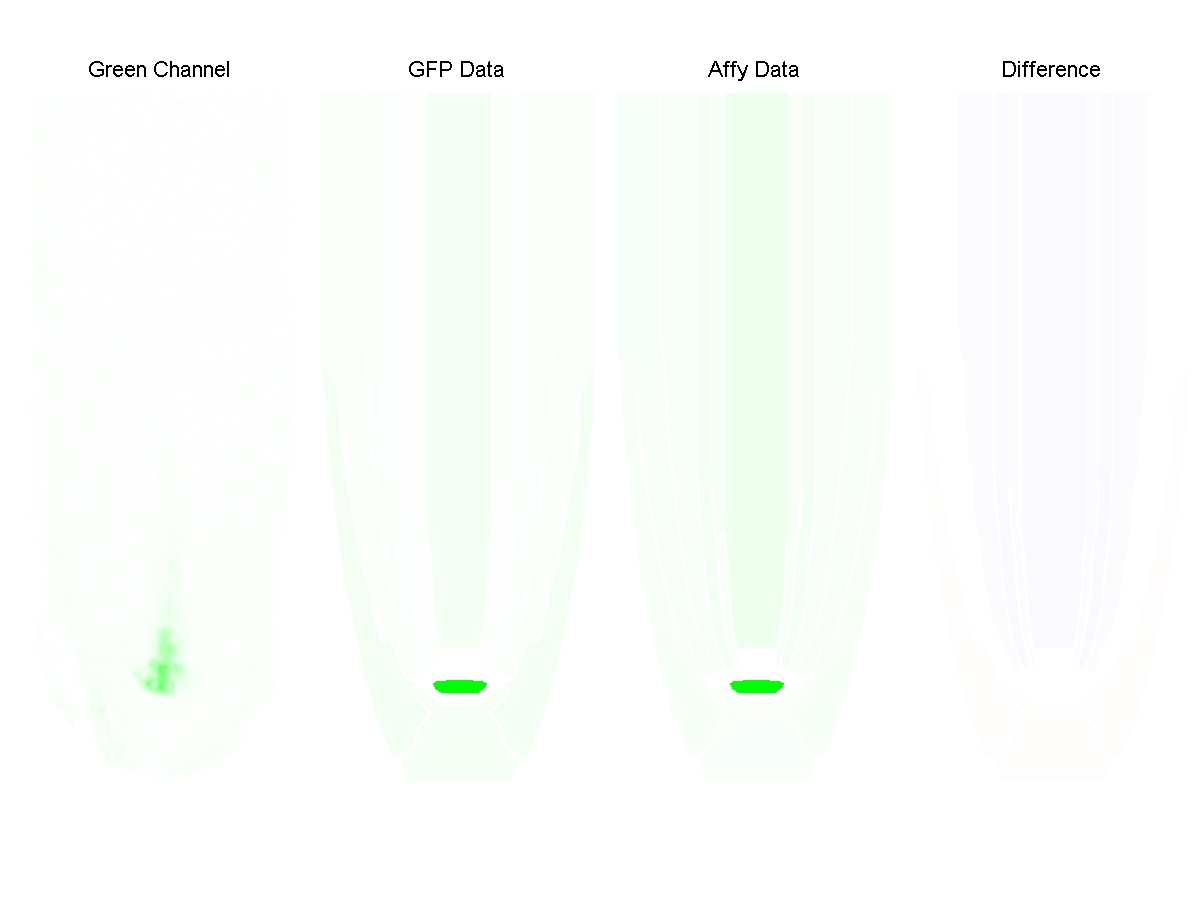
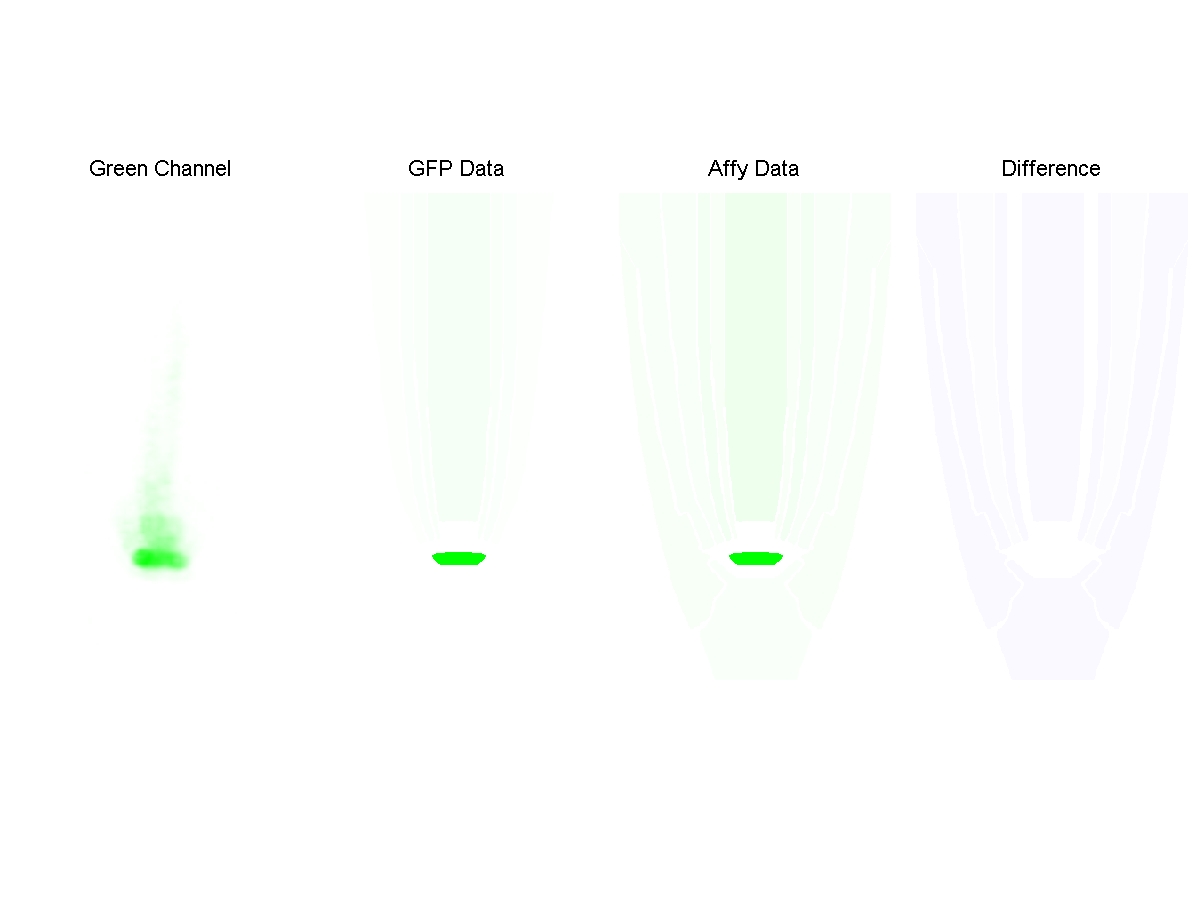
| General Information | Image | Atlas Mapped | Tissue | Affy Data | GFP Data | Corelation/TPE Score
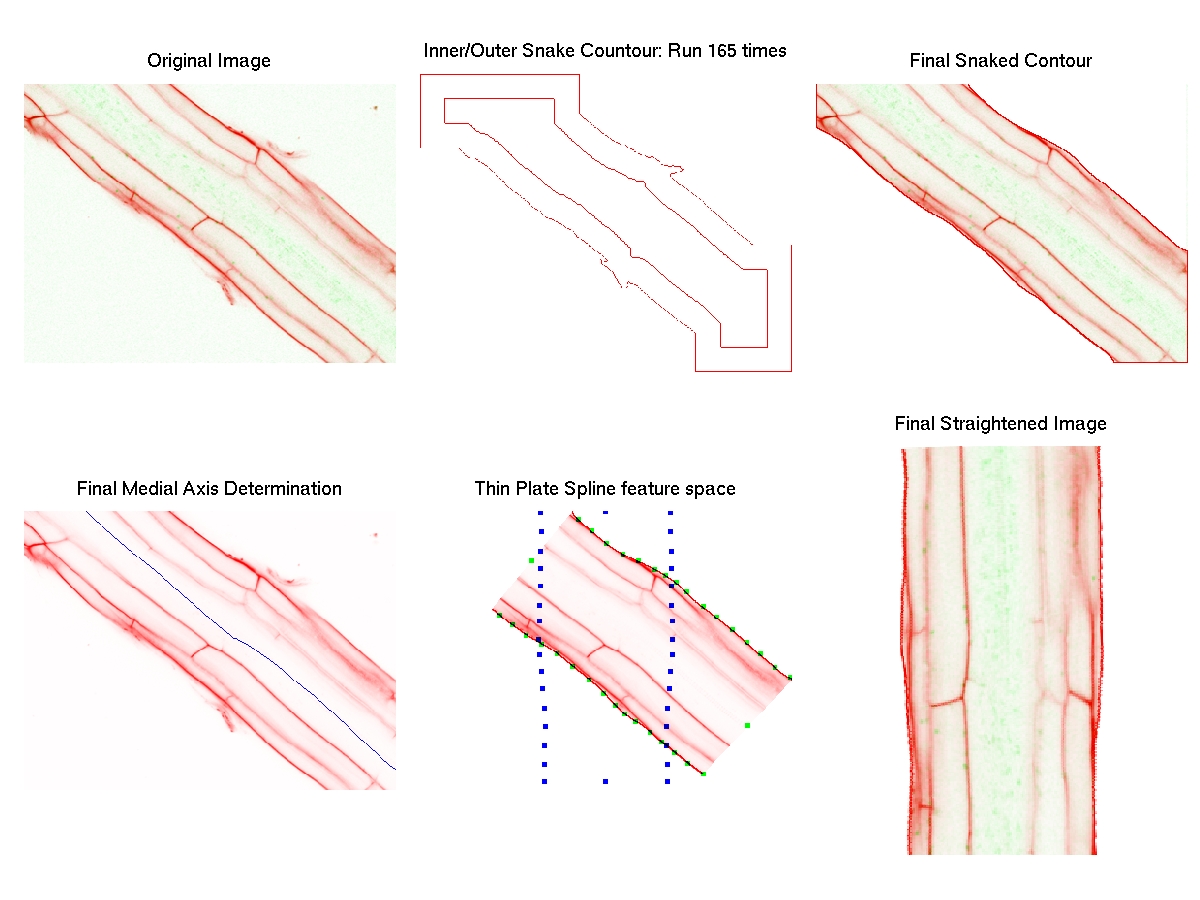
| | Row Number | Diagnostic Image
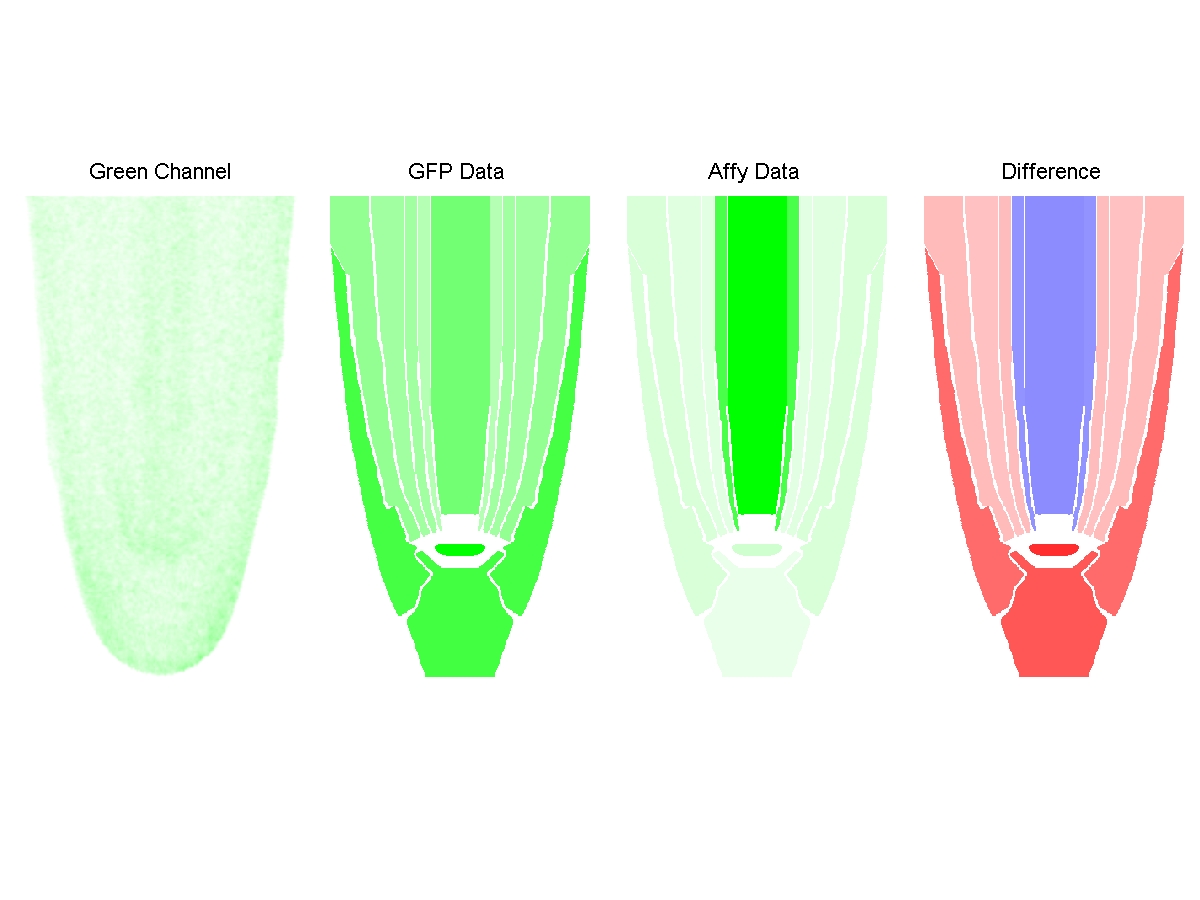
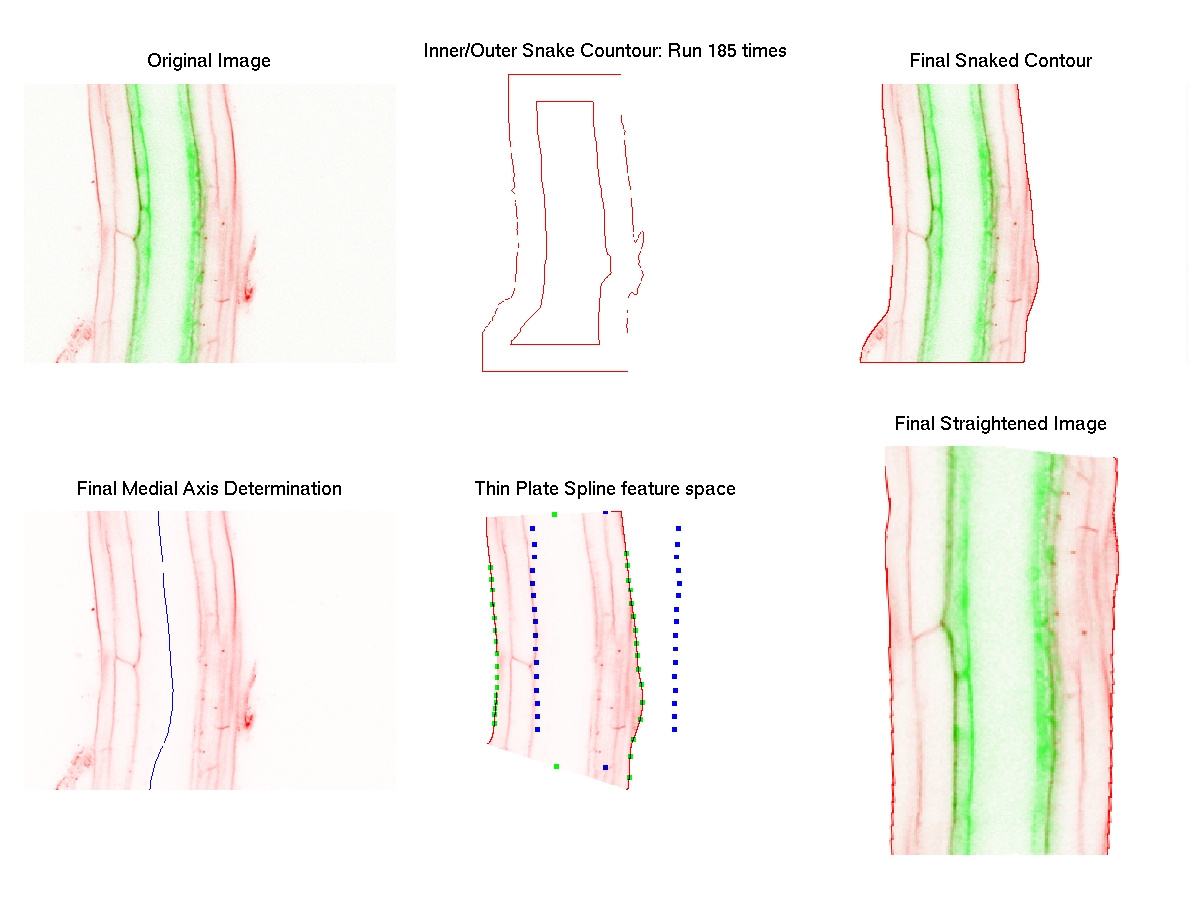
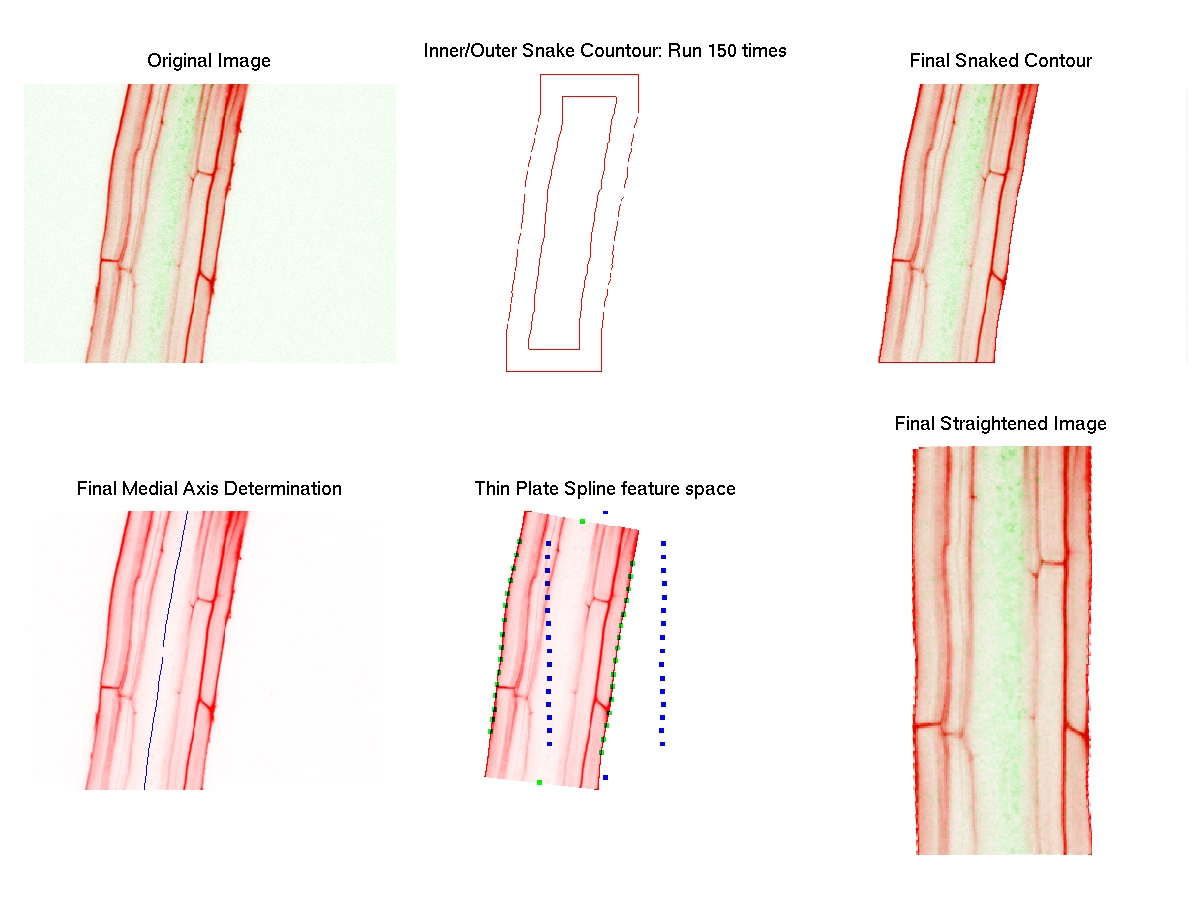
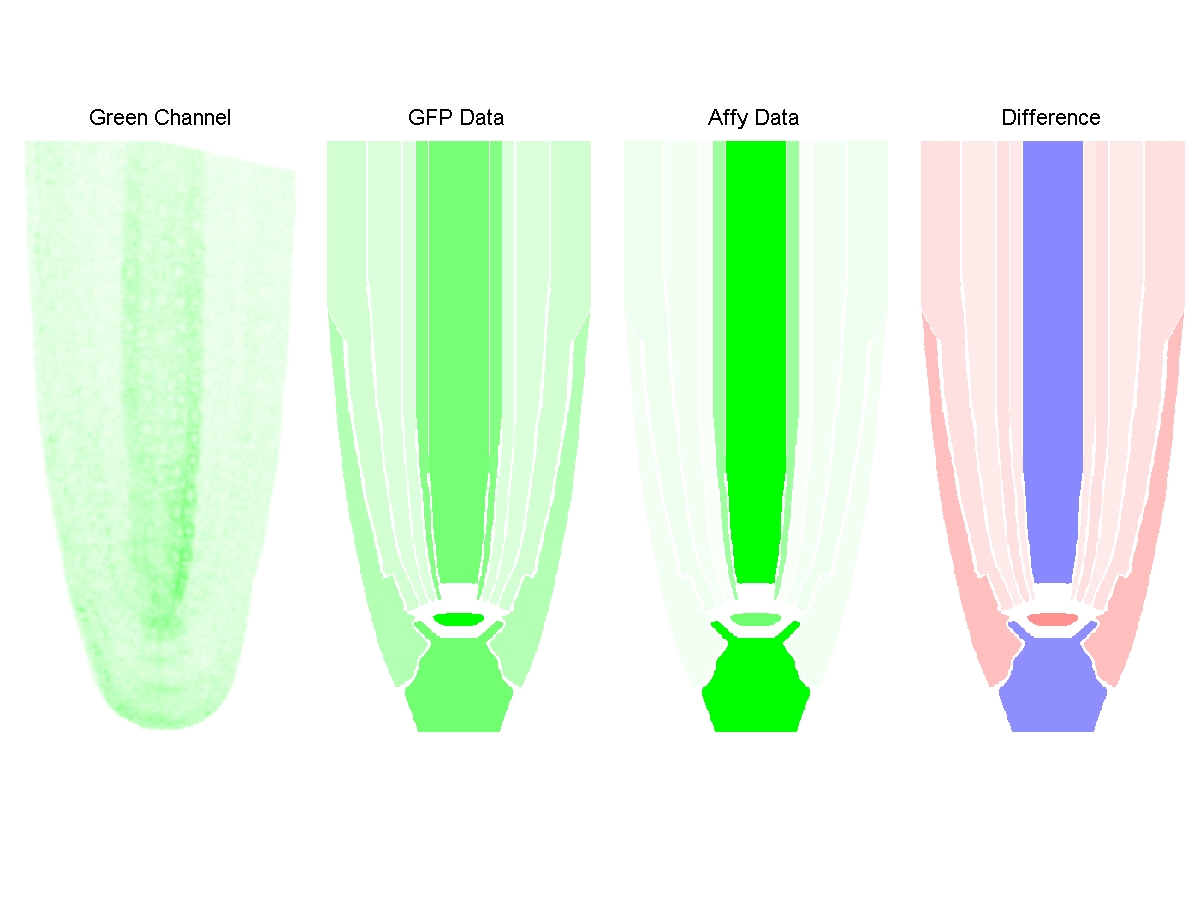
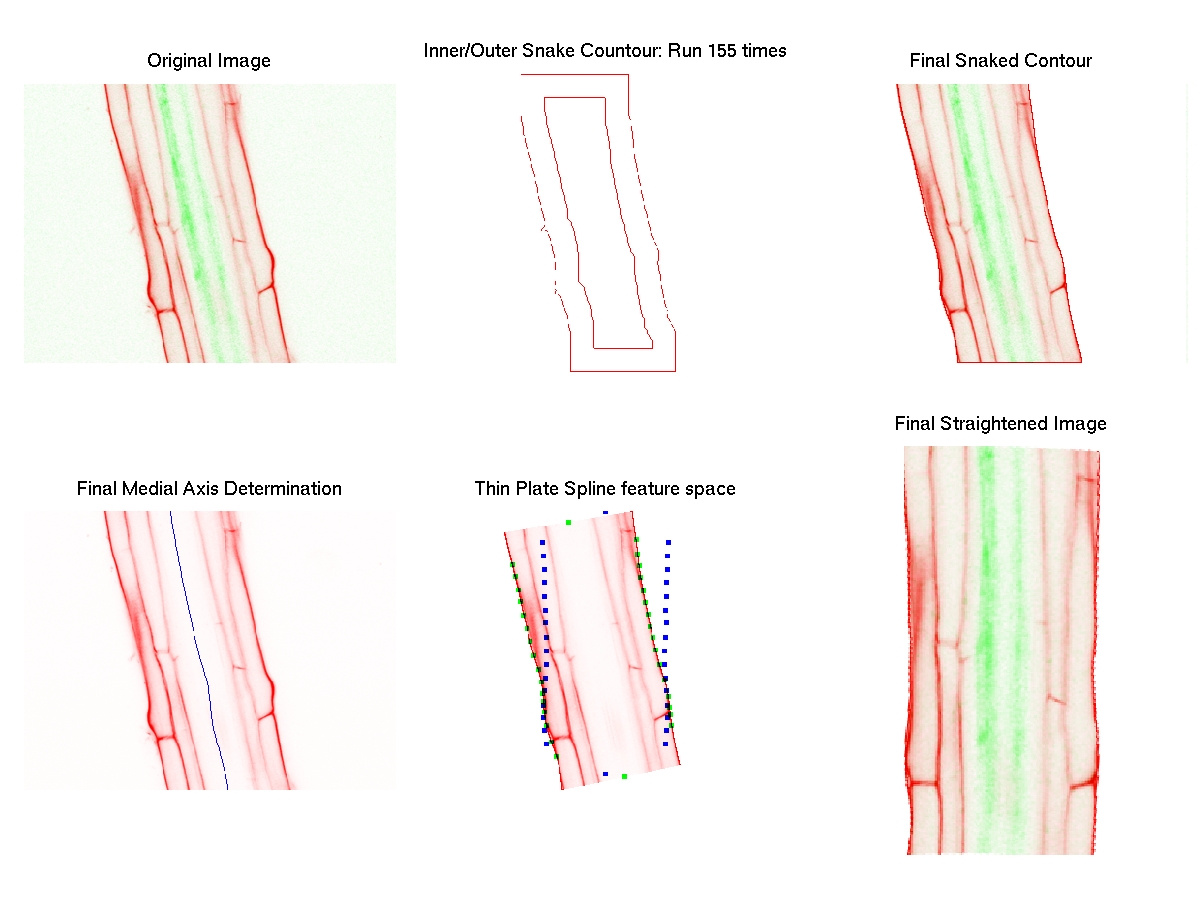
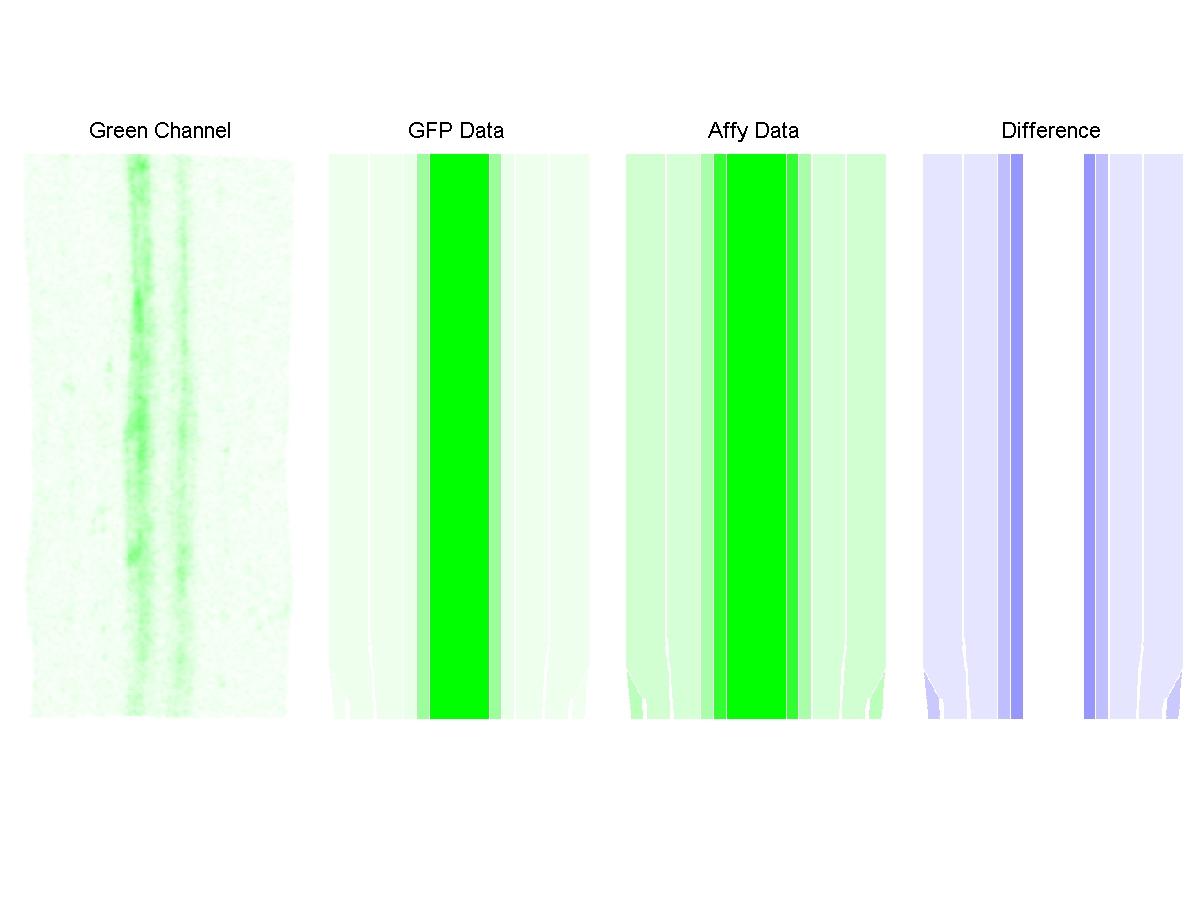
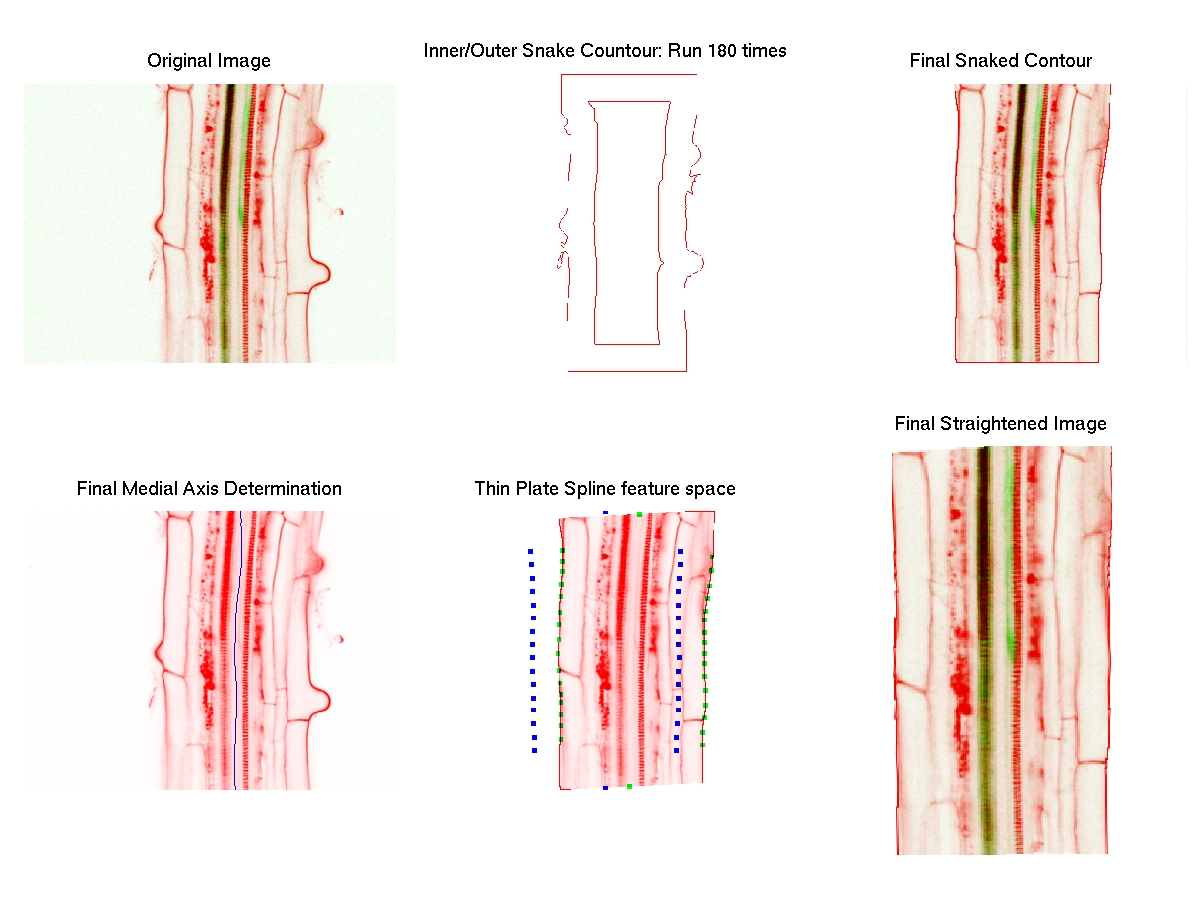
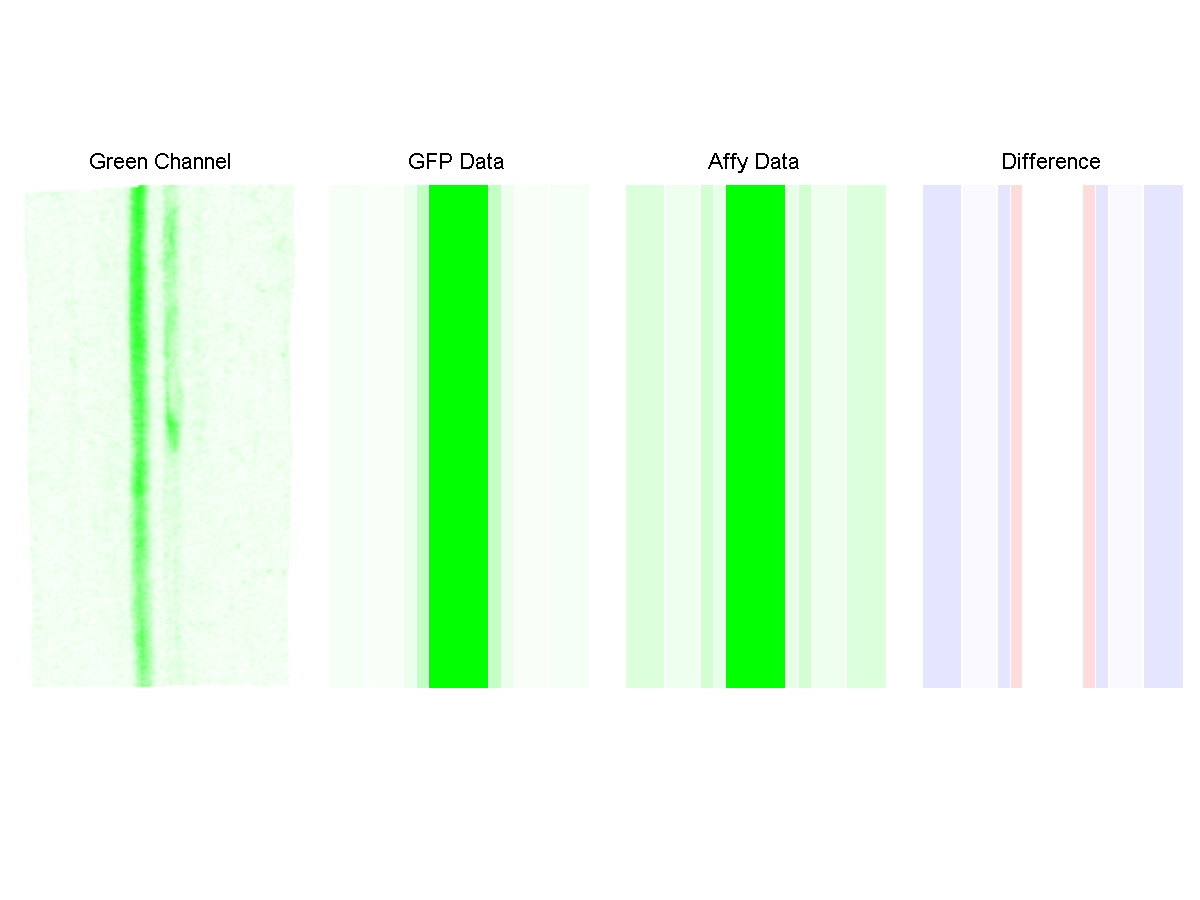
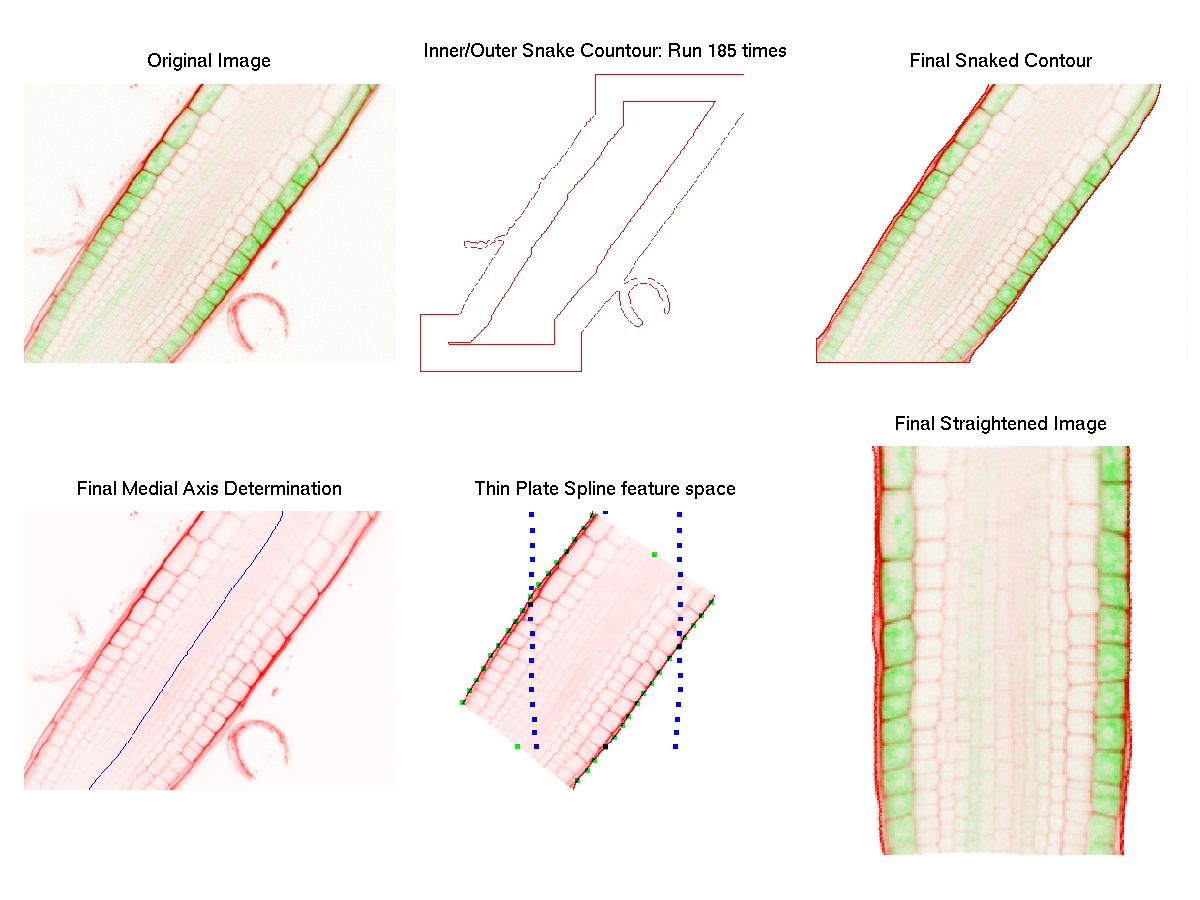
(click to enlarge) |  |  | Columella | NA | NA | Correlation
|
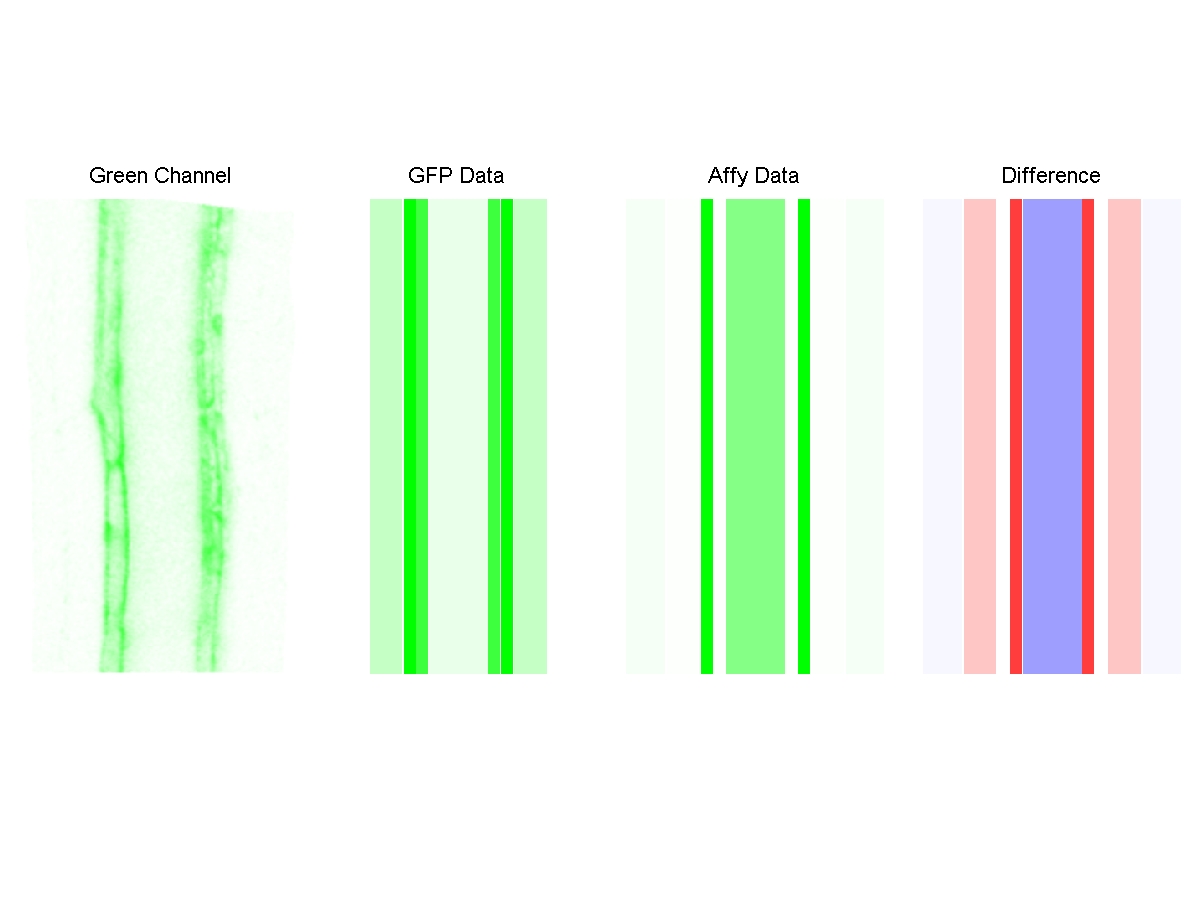
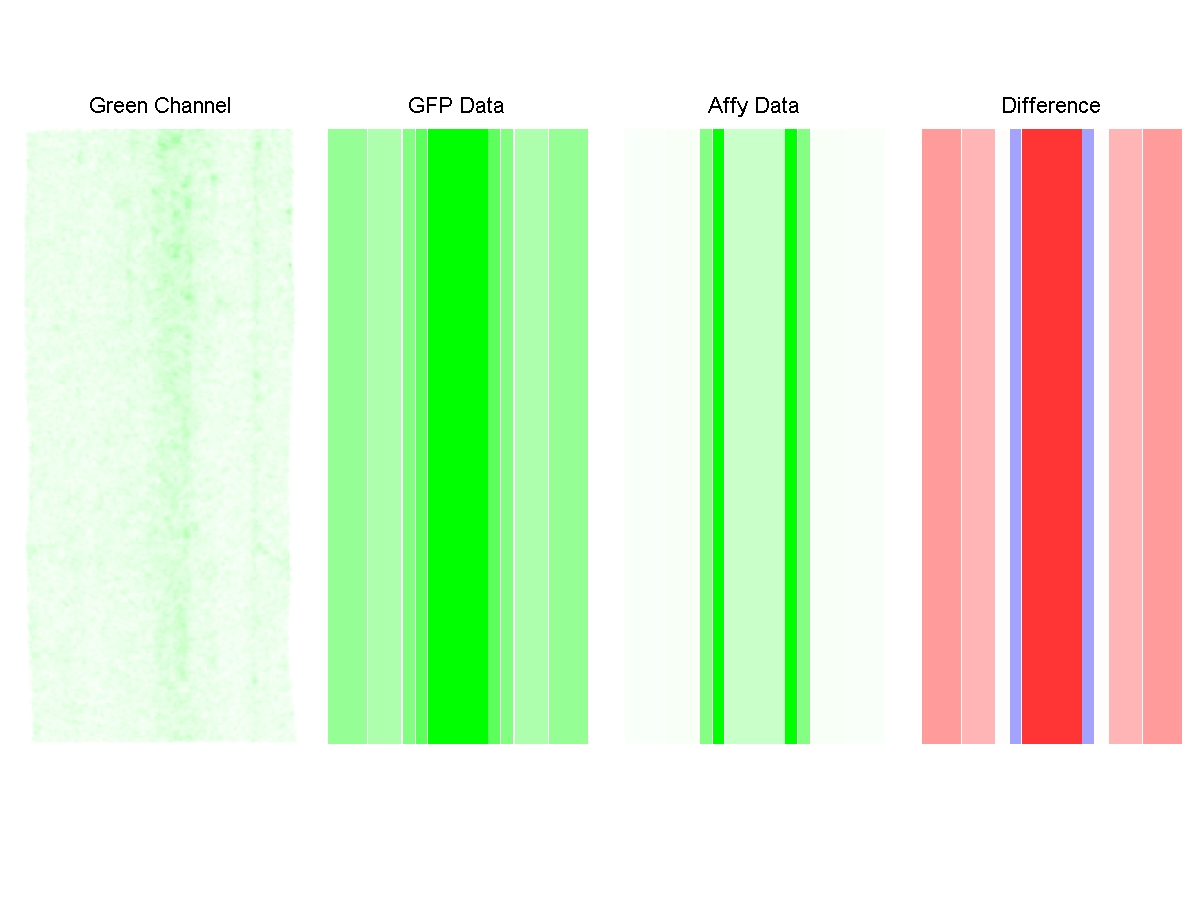
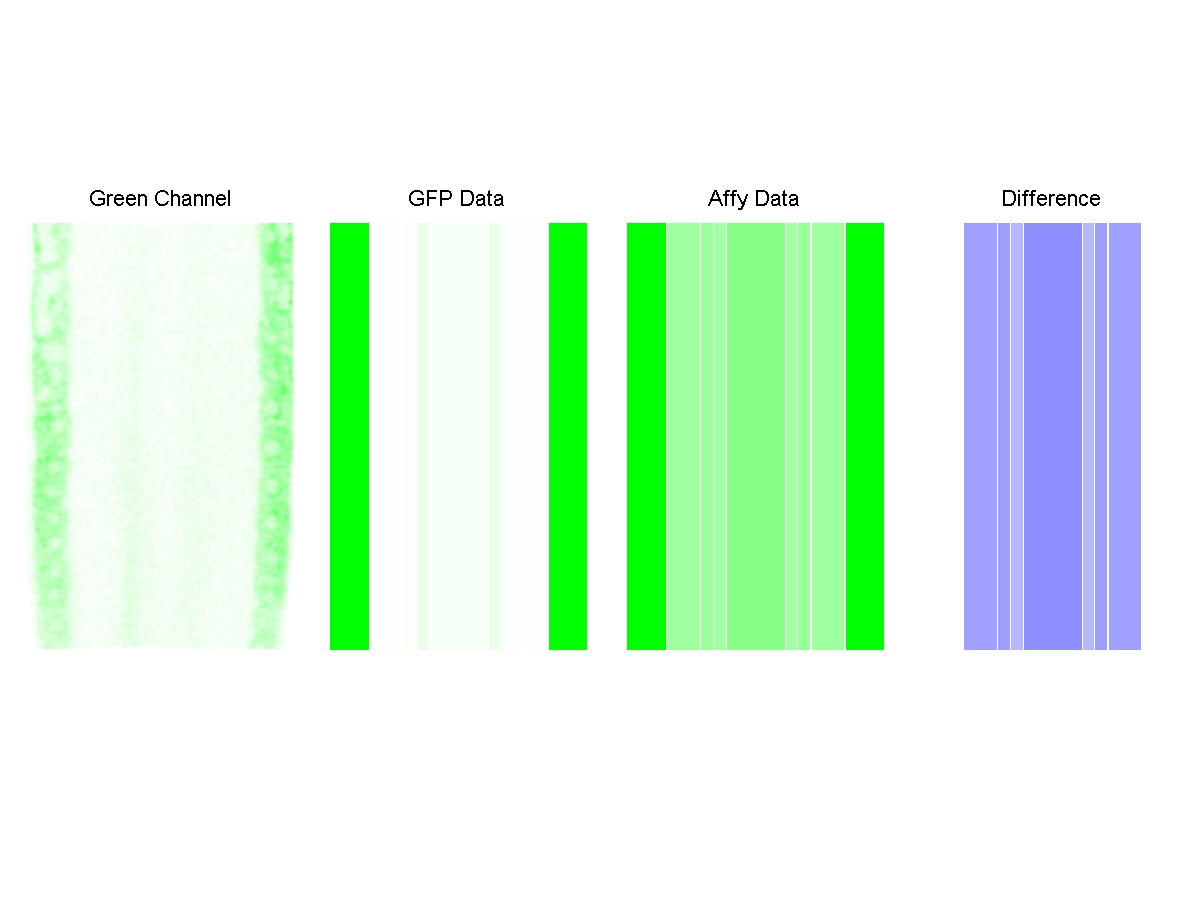
| 1 of 111 |  | Cortex | 181.83 | 0.0766 | -0.406469400712316 |
| AGI Number | Endodermis | 237.27 | 0.0907 |
| AT4G28890 | Epidermis | 30.07 | 0.0955 |
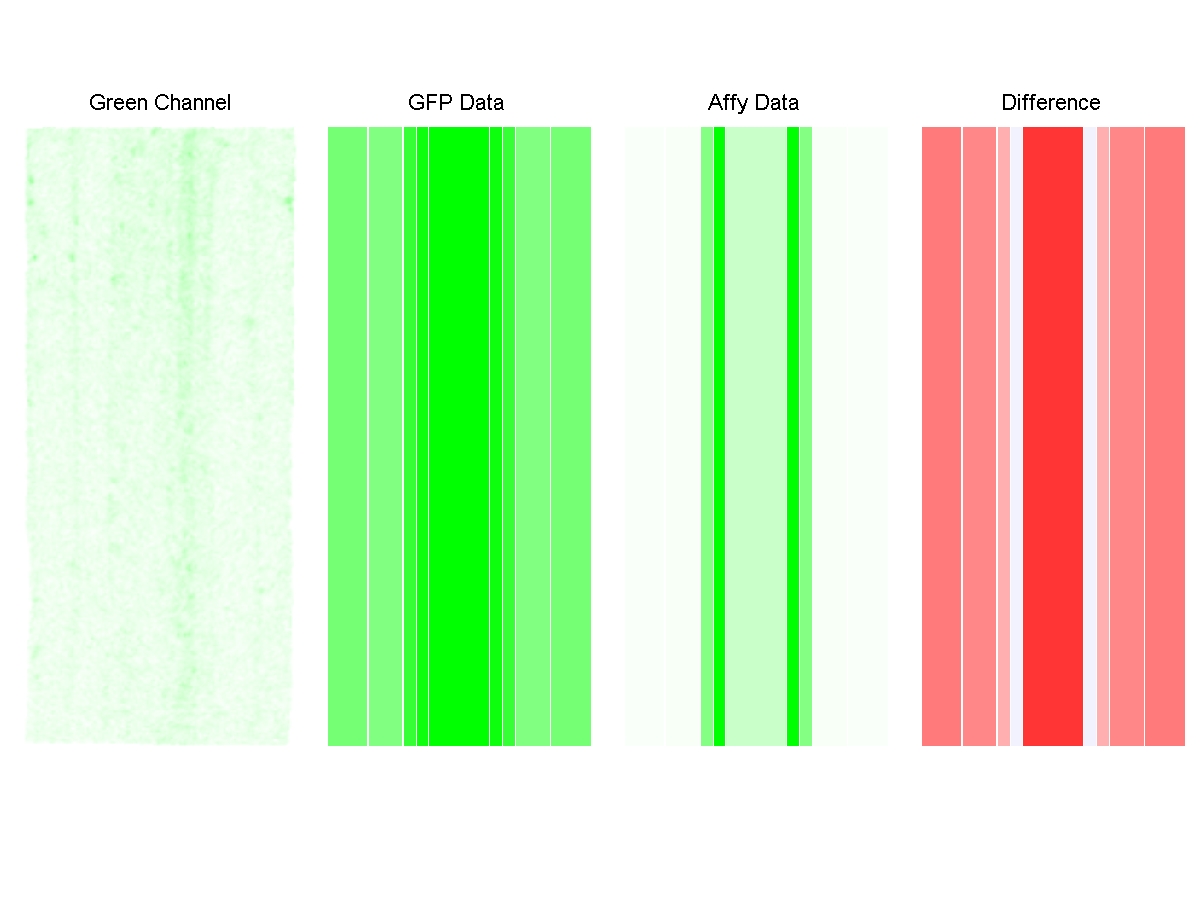
| File Name | Difference Image
(click to enlarge) | Lateral Root Cap | NA | NA | TPE Score |
| 328_2_41strainormal |  | Pericycle | 72.13 | 0.0915 | 0.9643999 |
| Line Number | QC | NA | NA |
| 328 | Stele | 82.77 | 0.1332 |
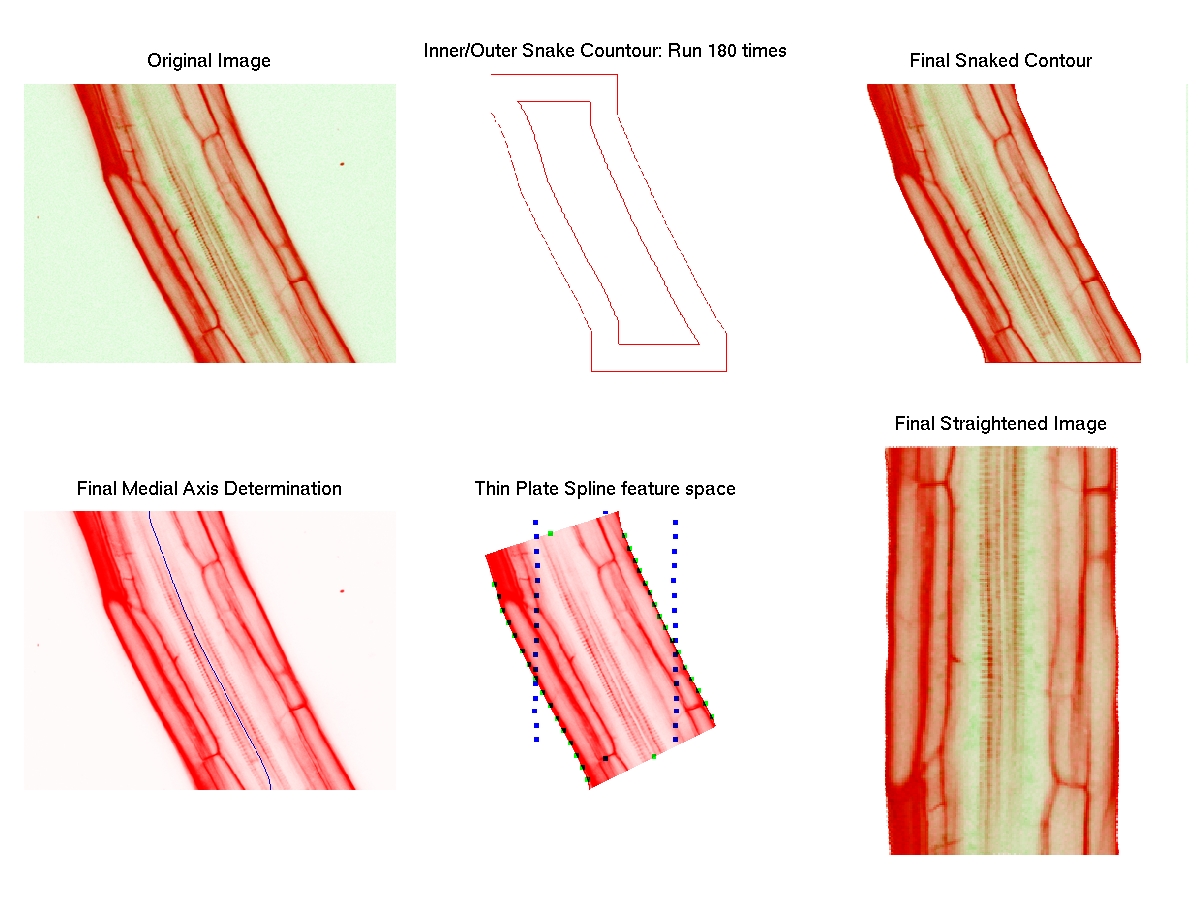
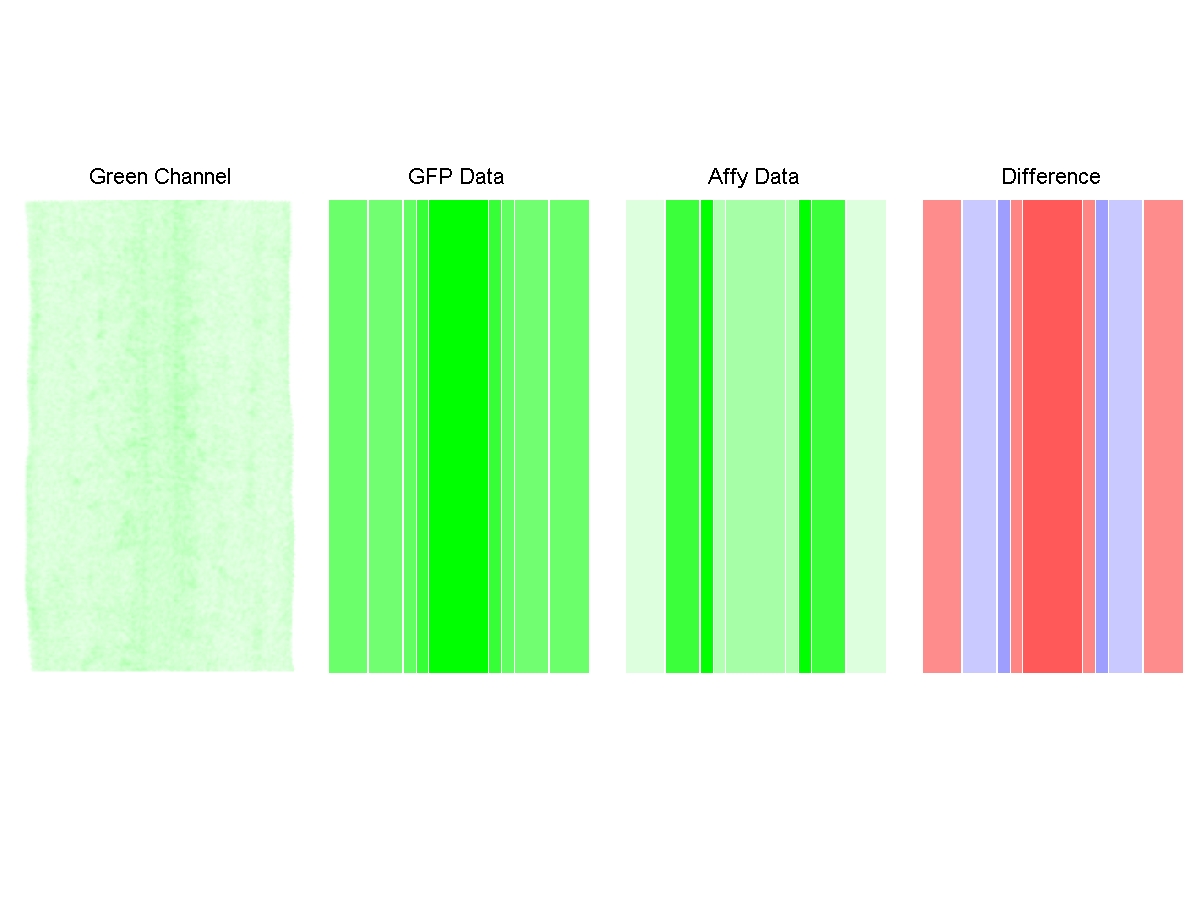
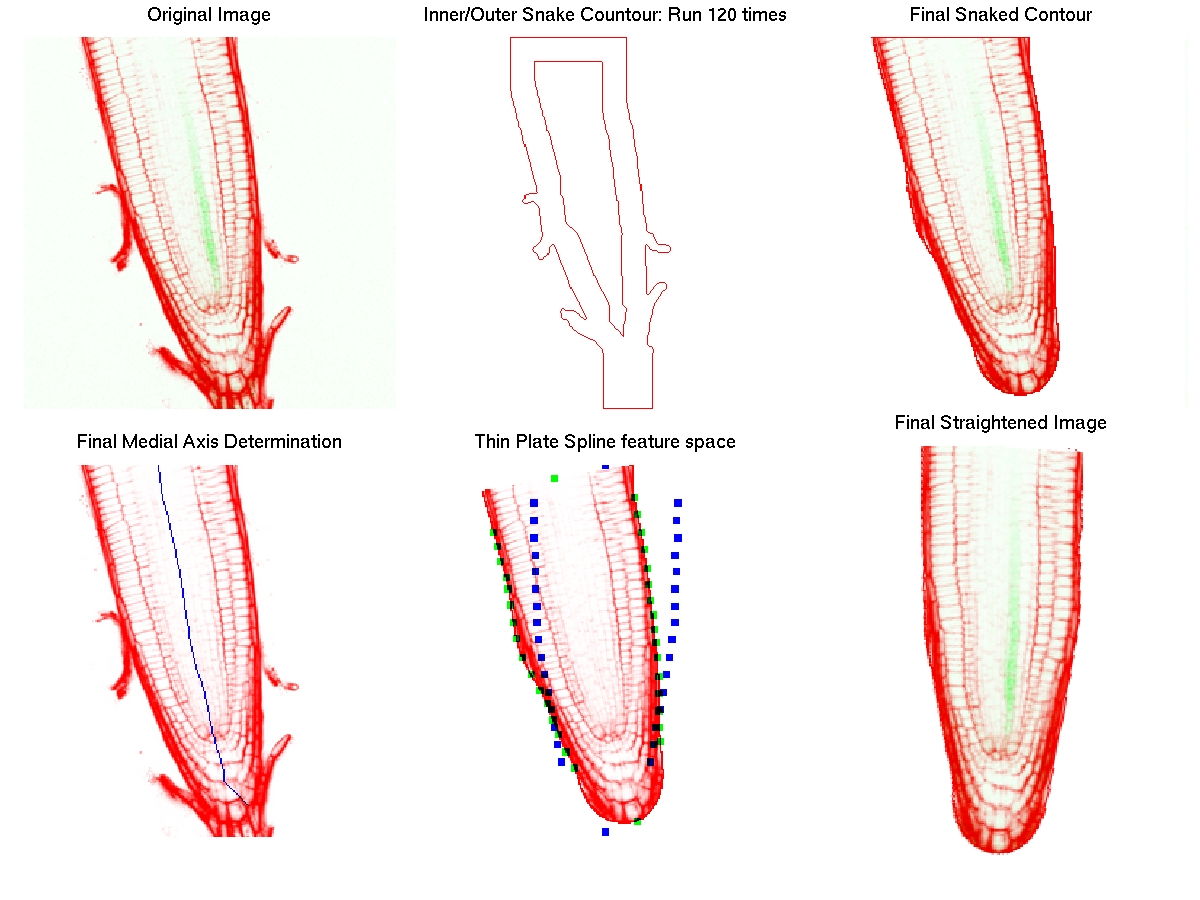
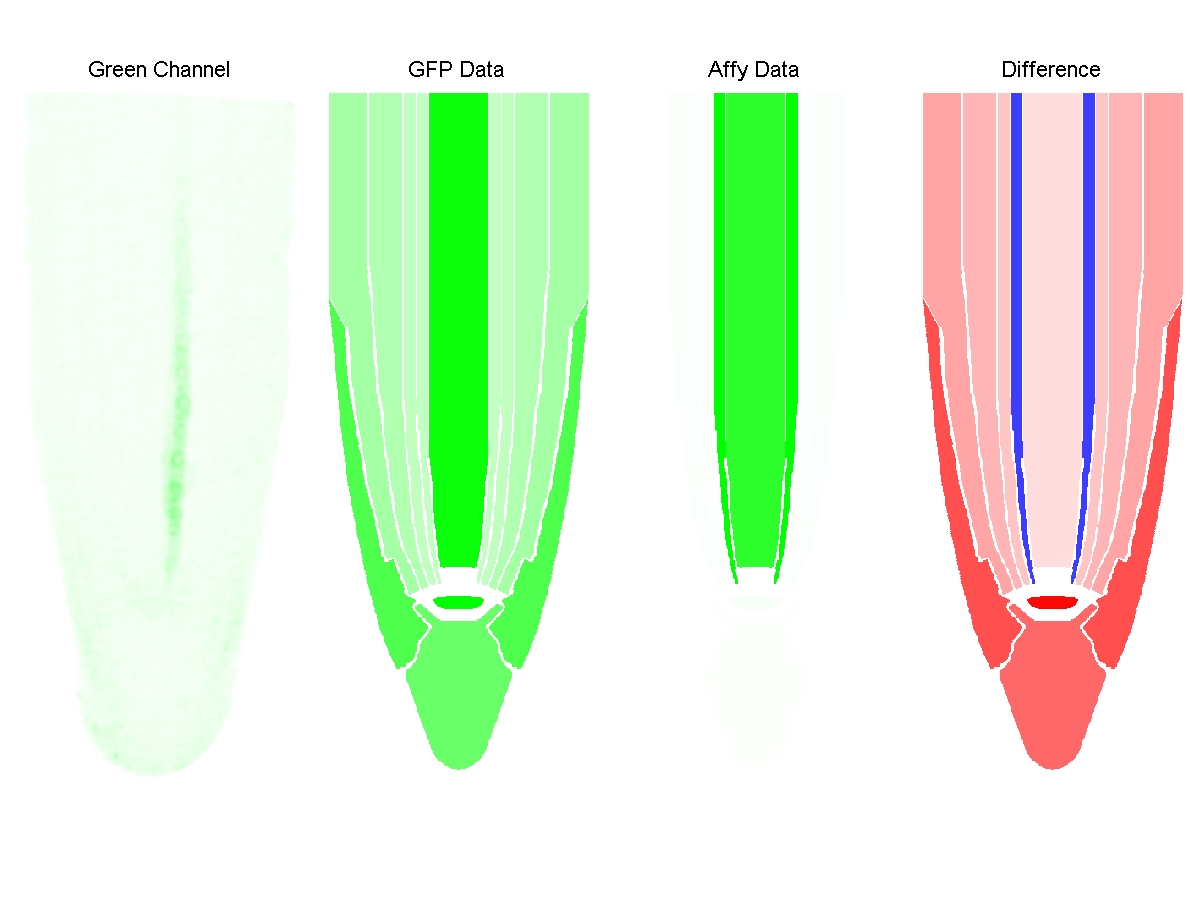
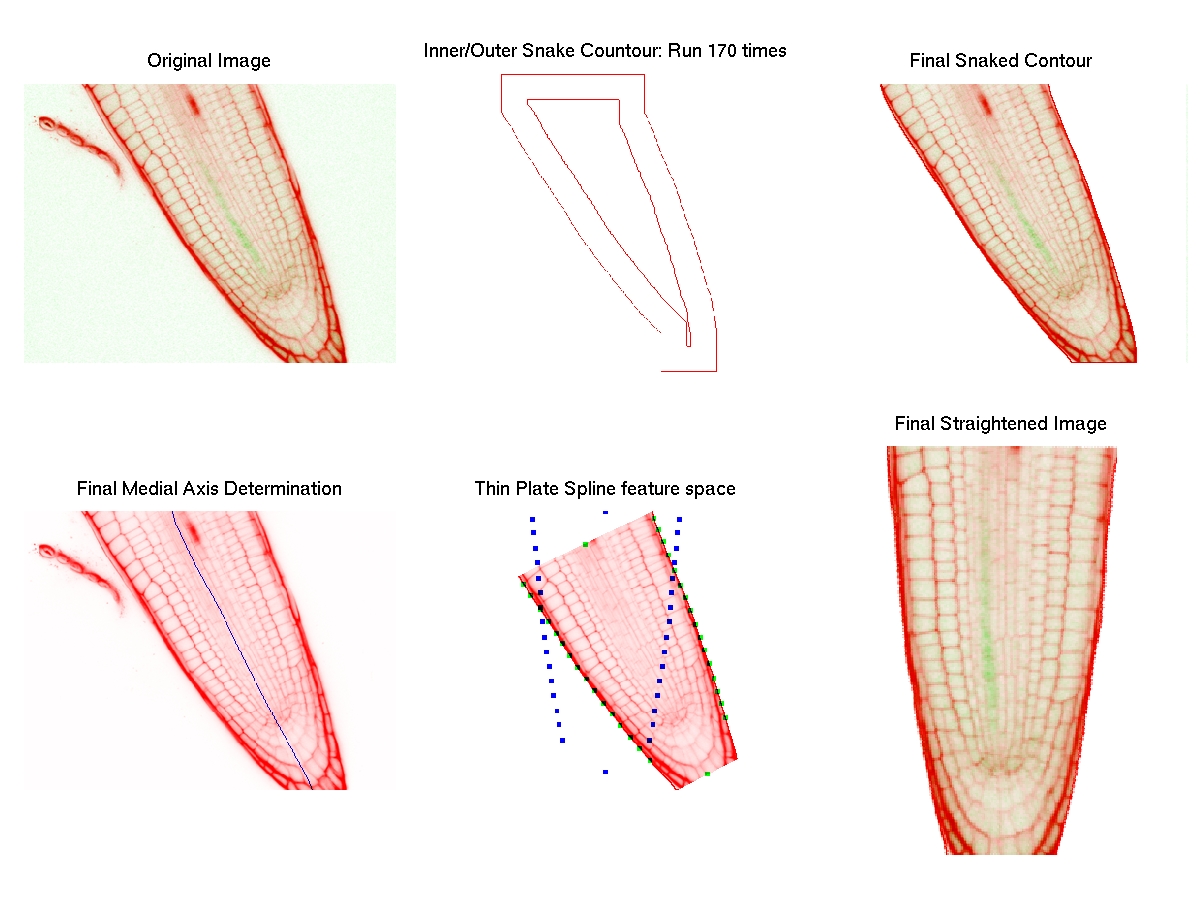
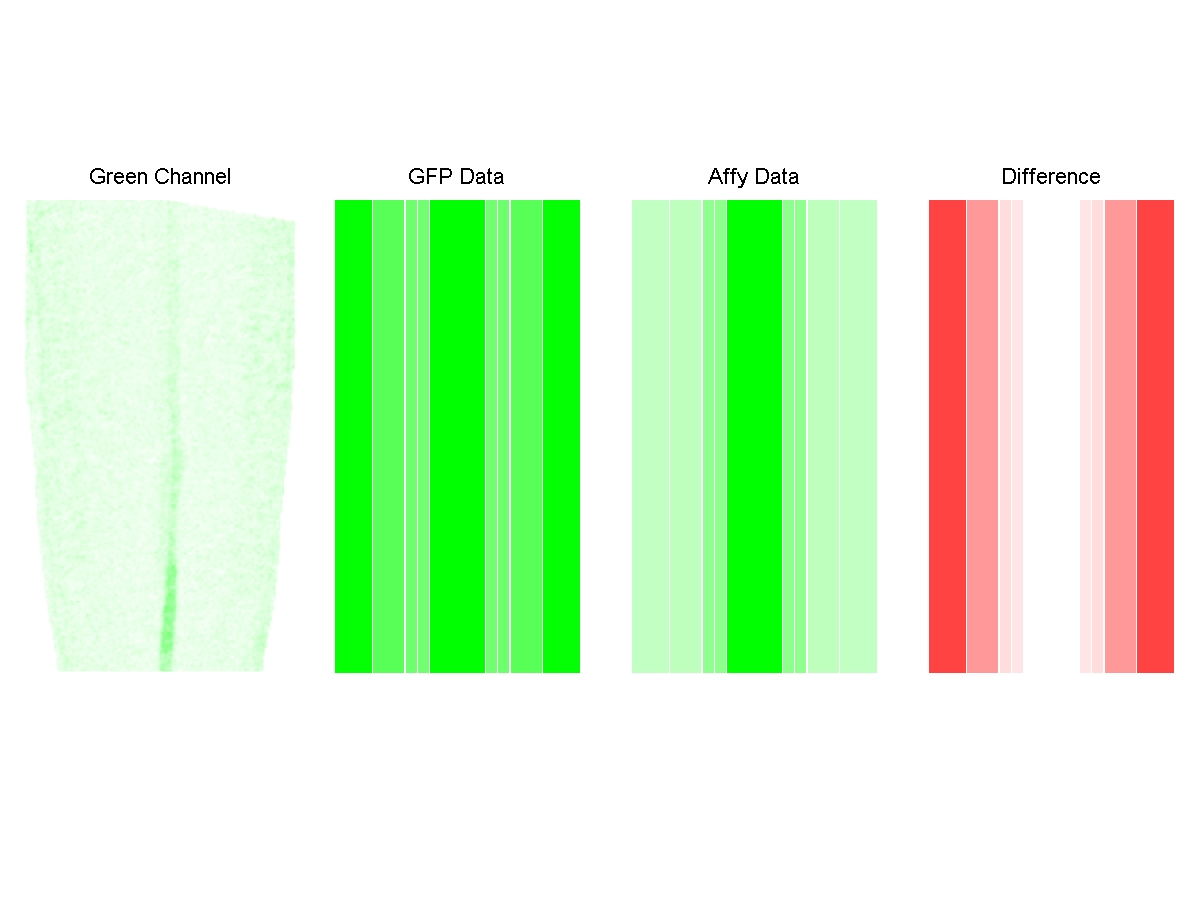
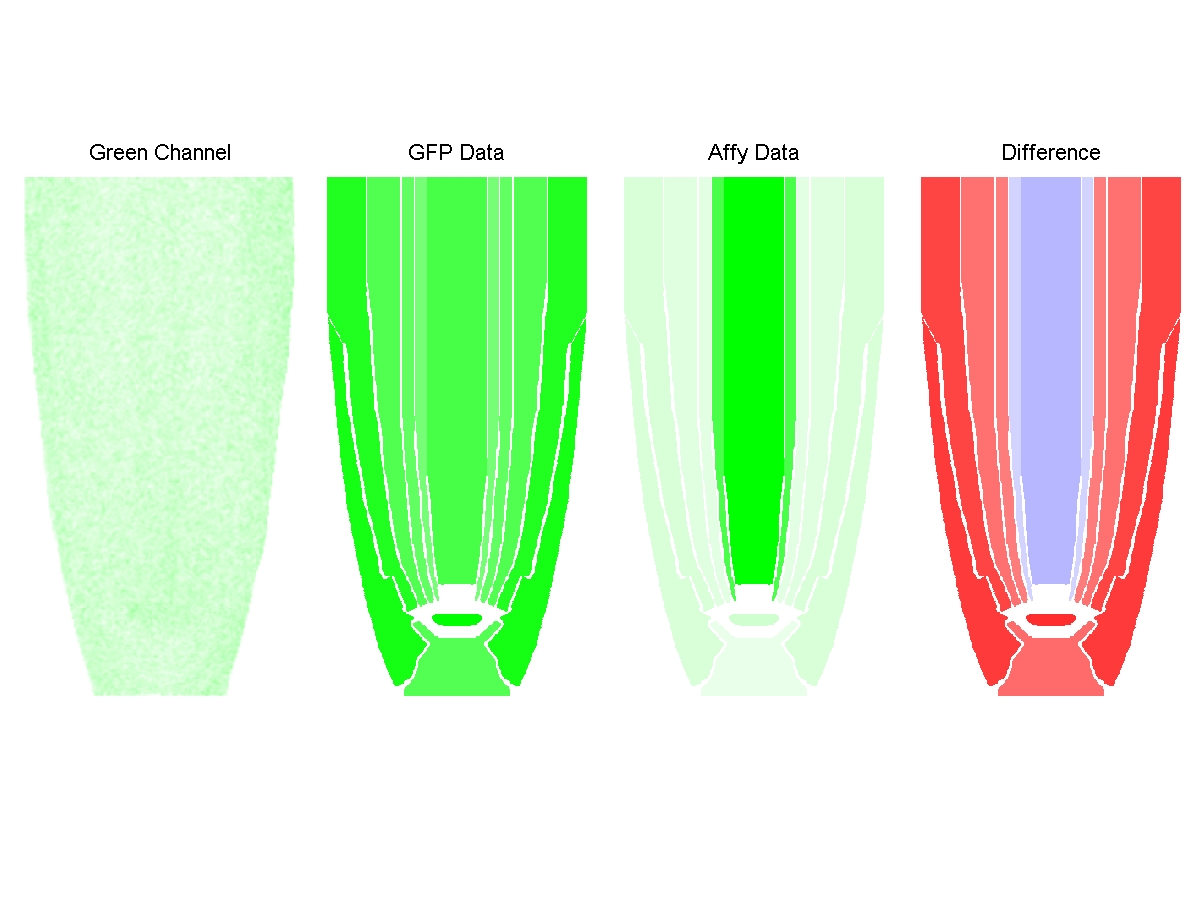
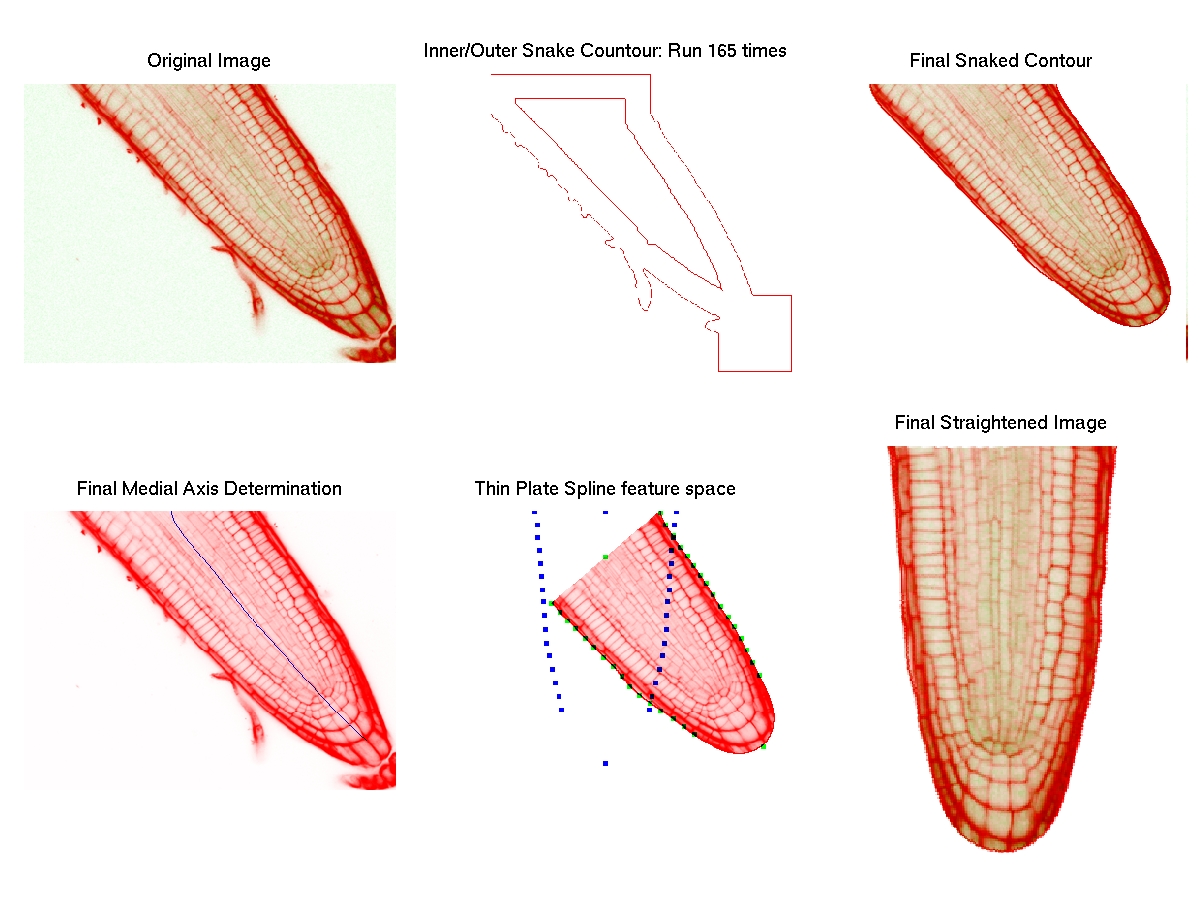
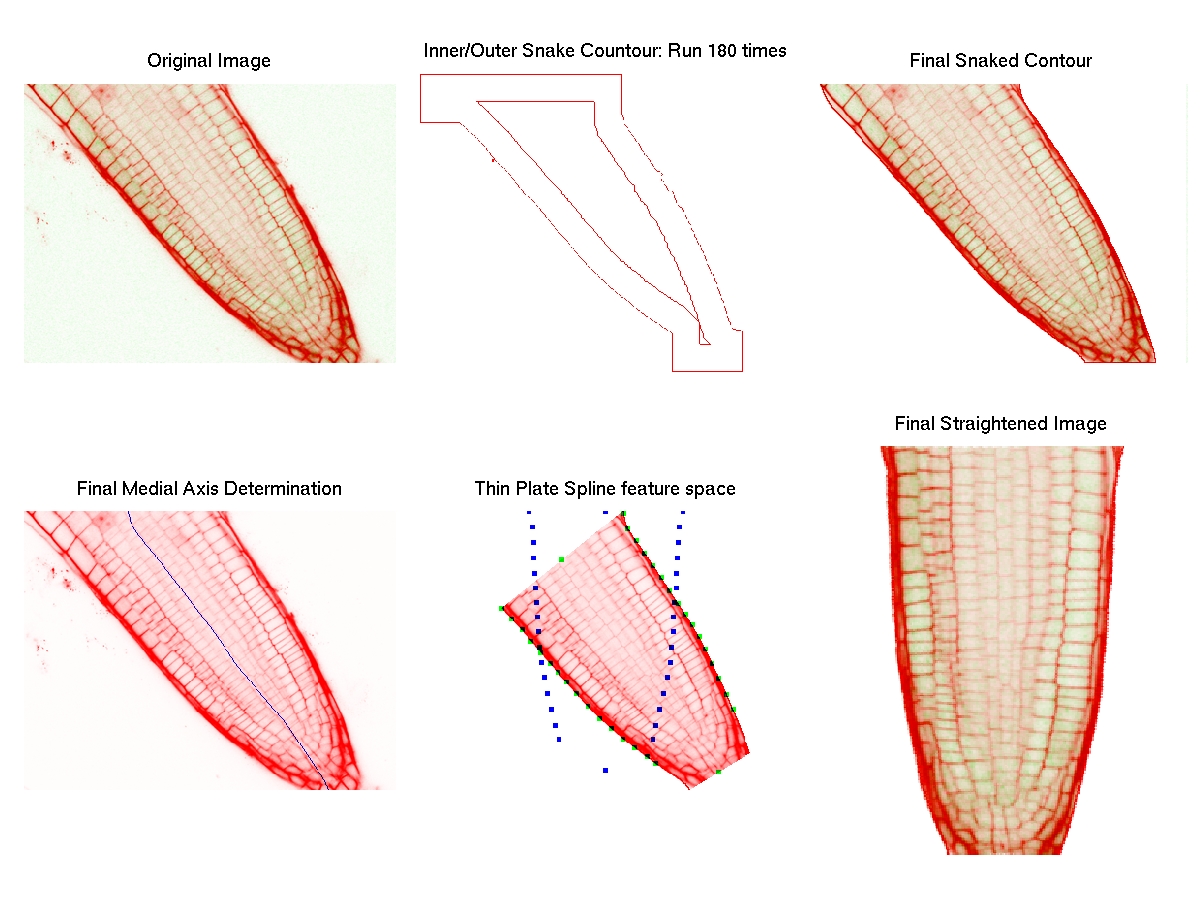
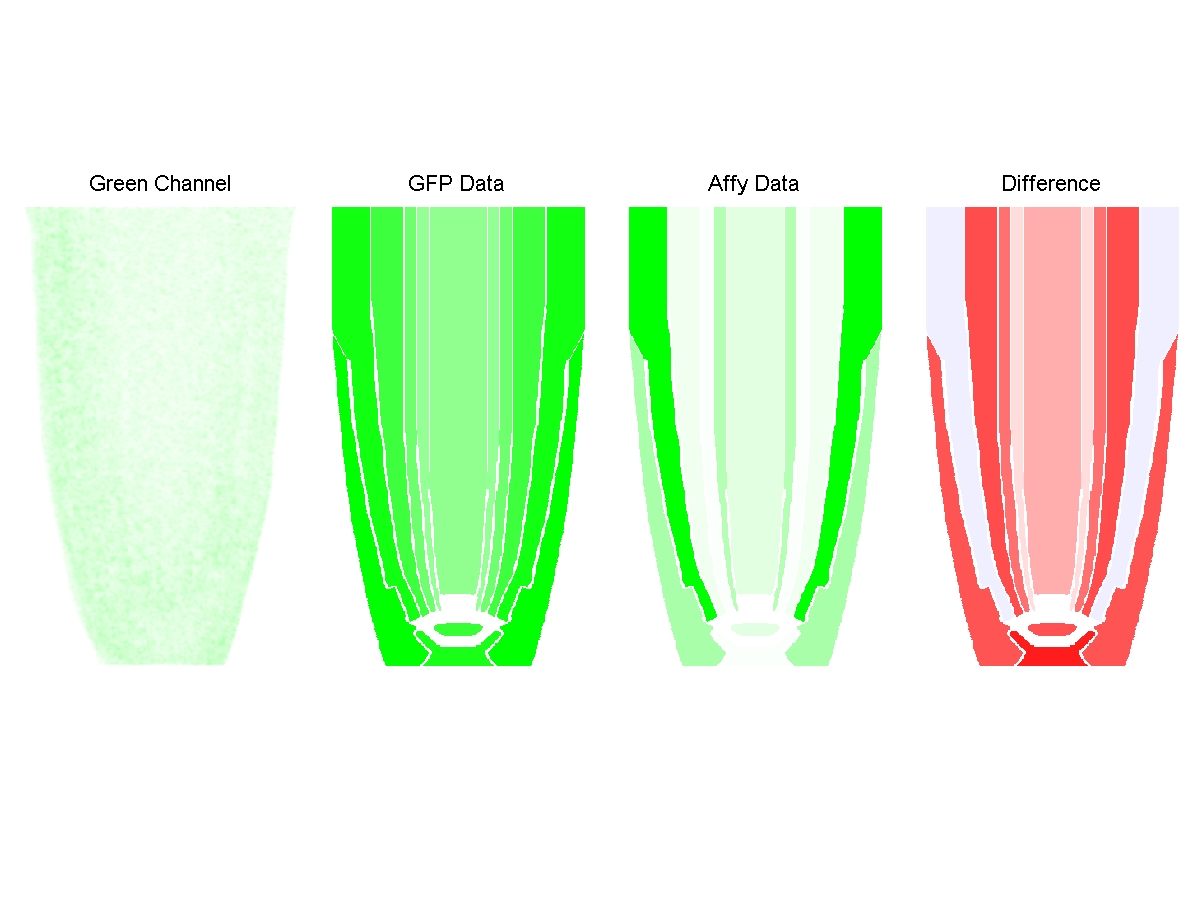
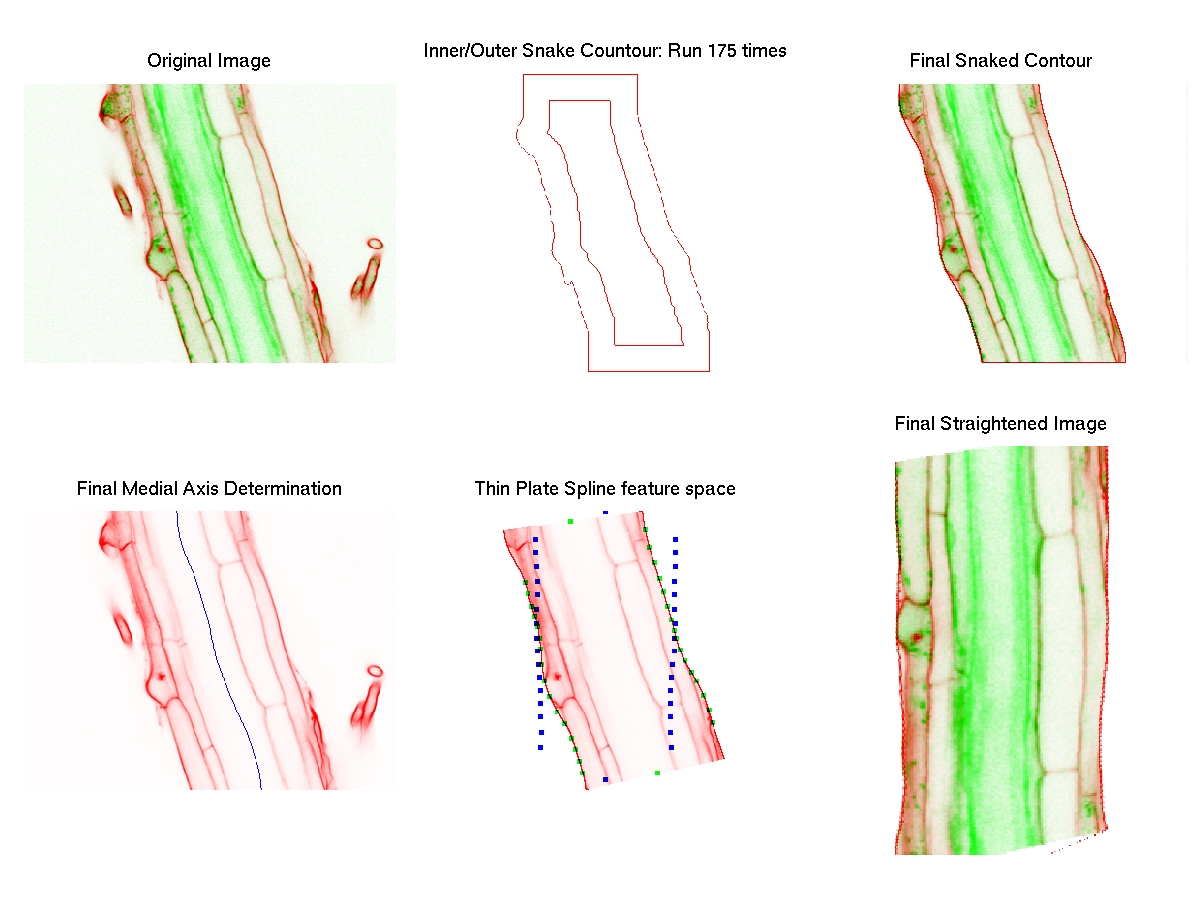
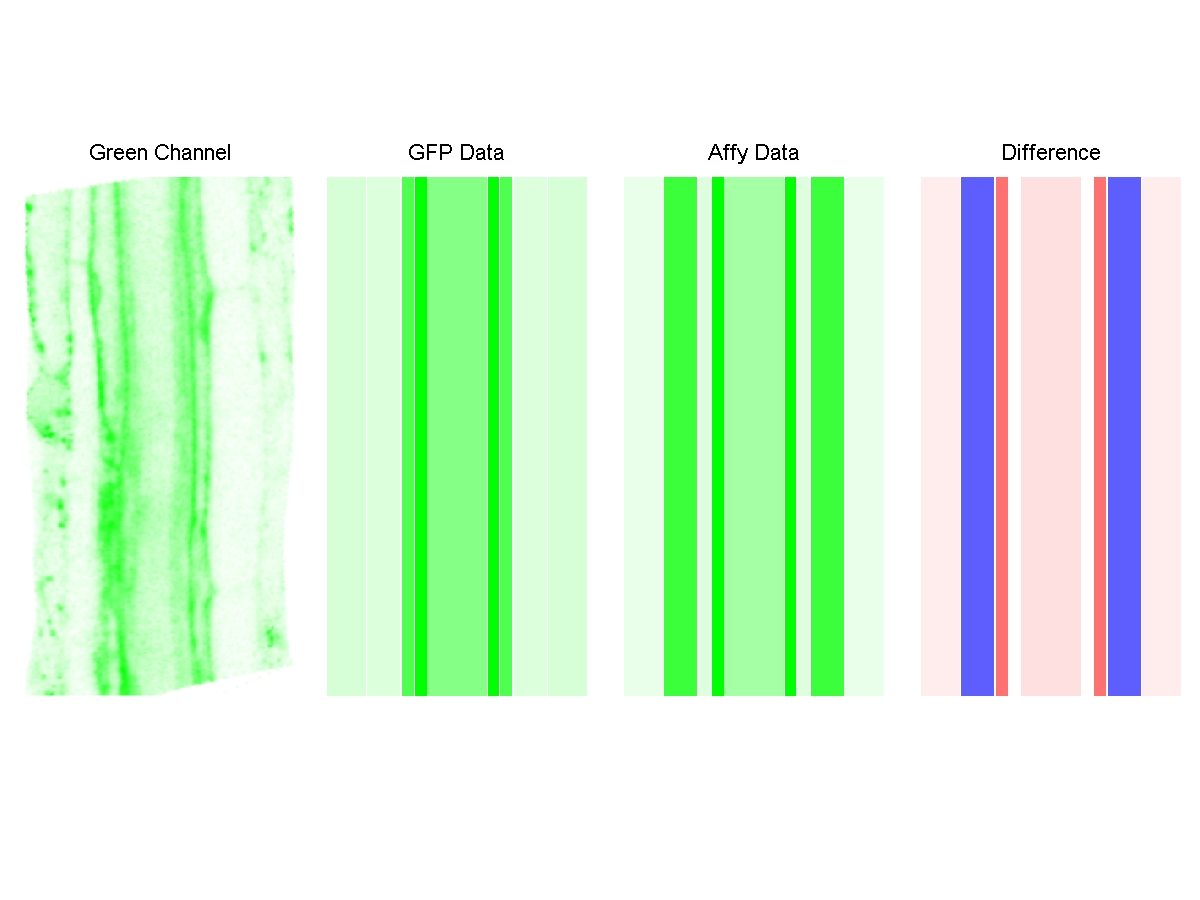
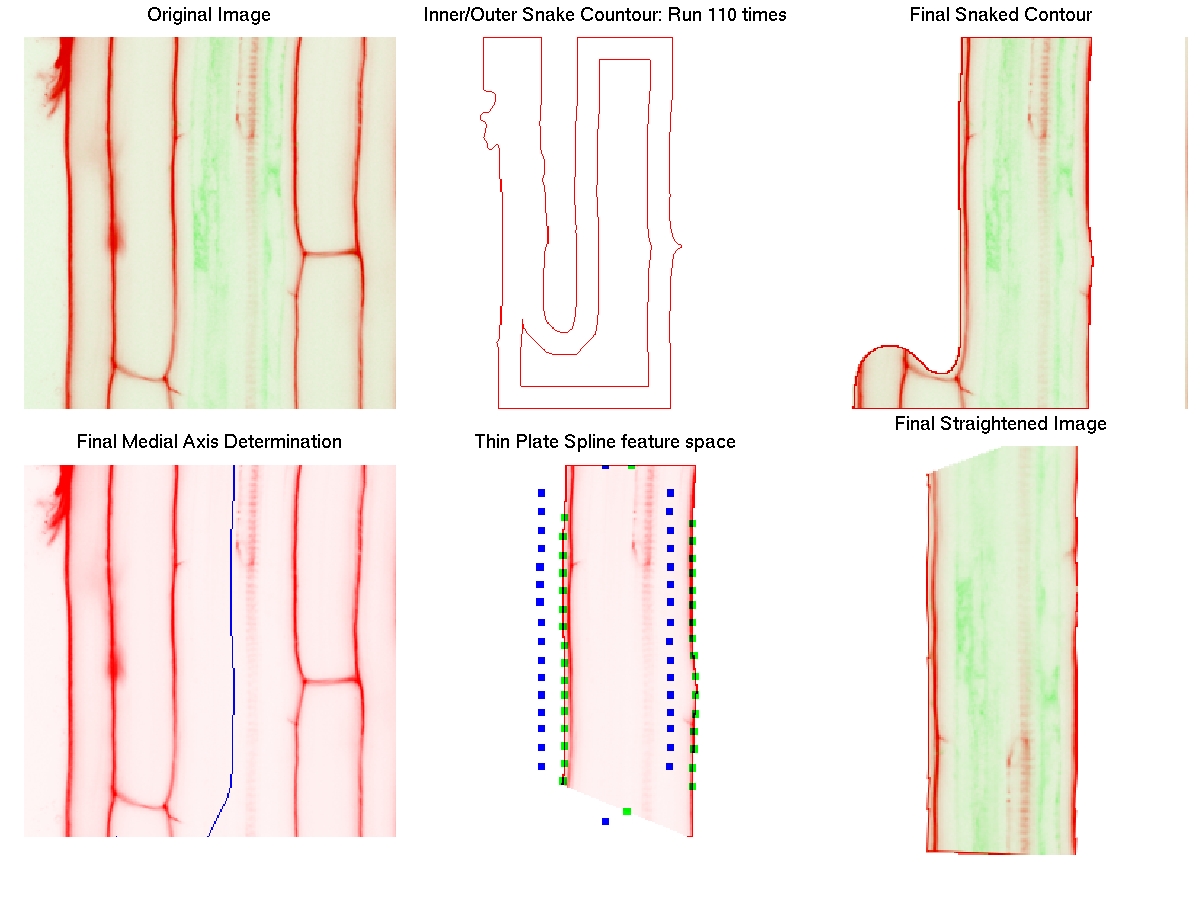
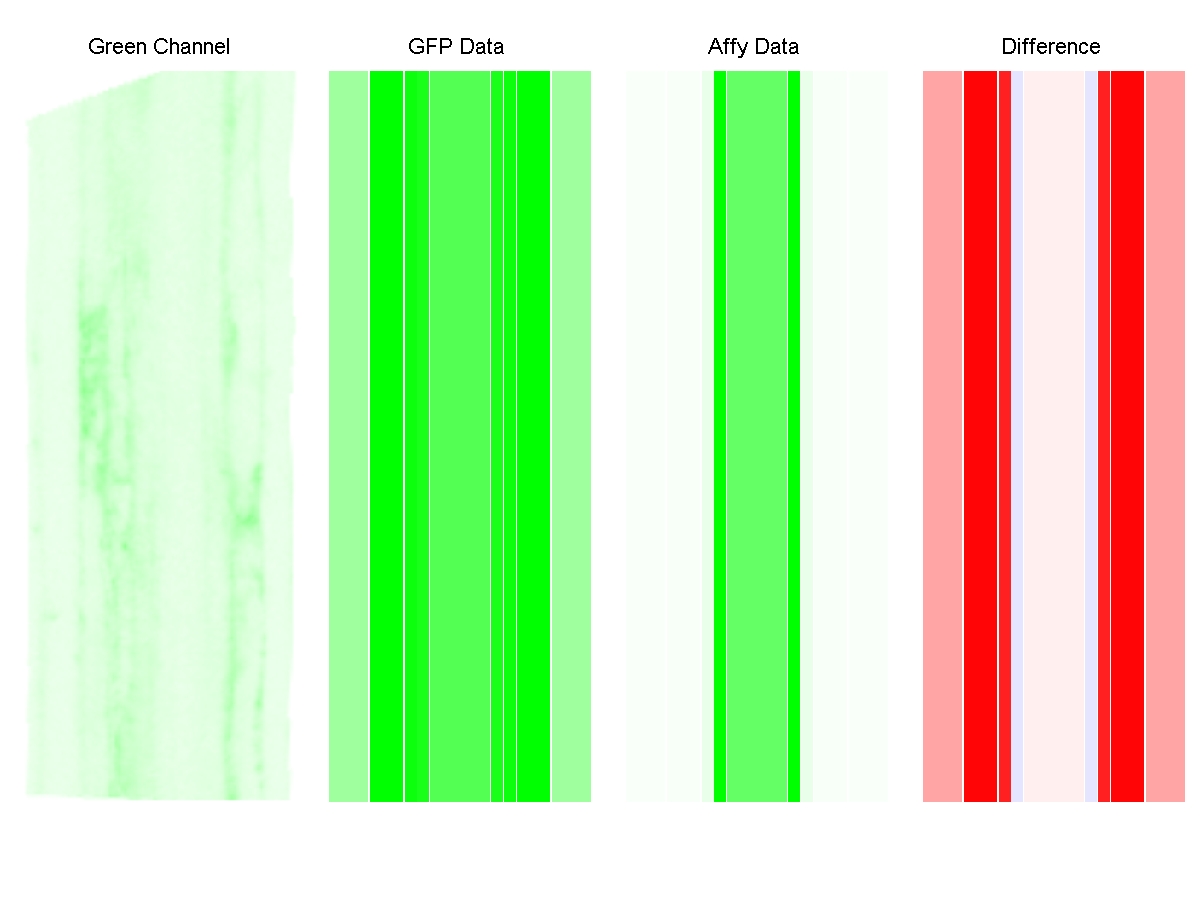
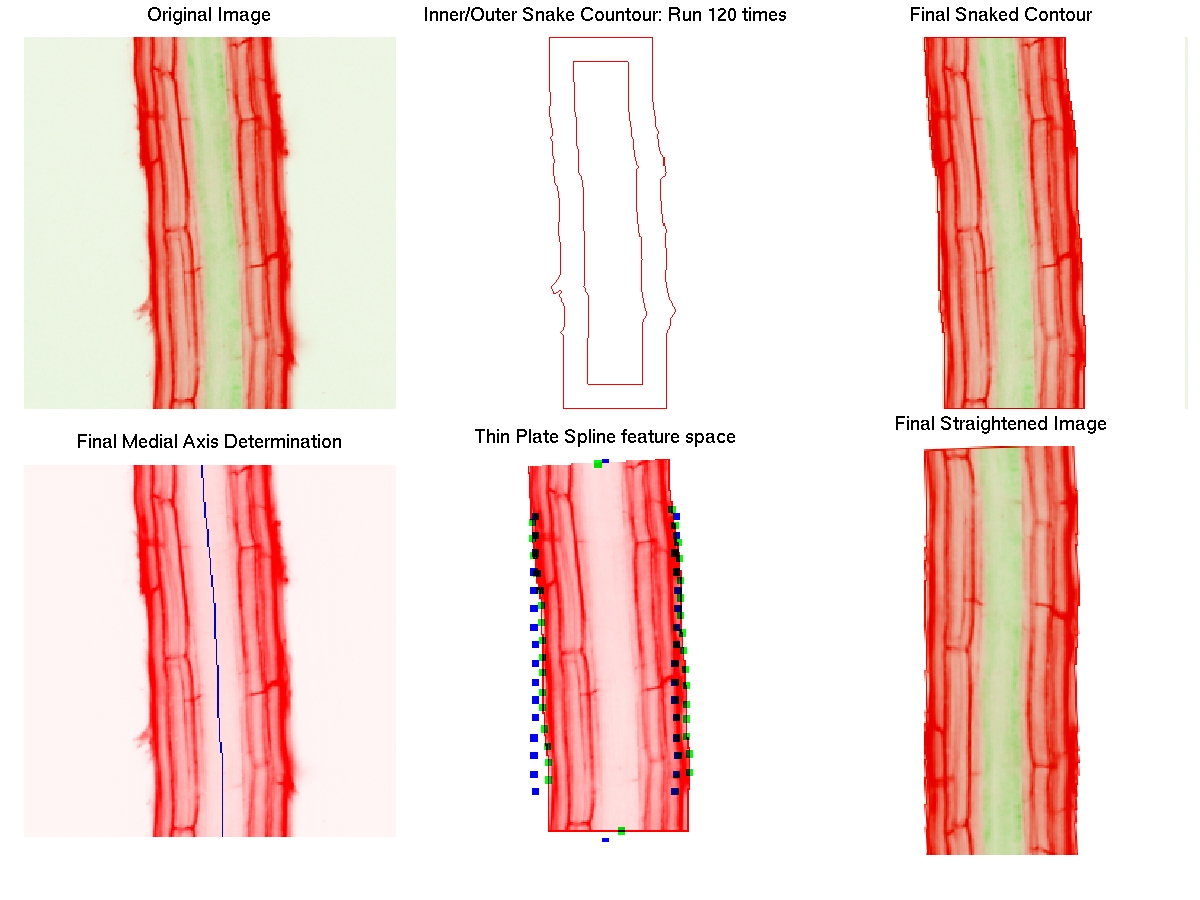
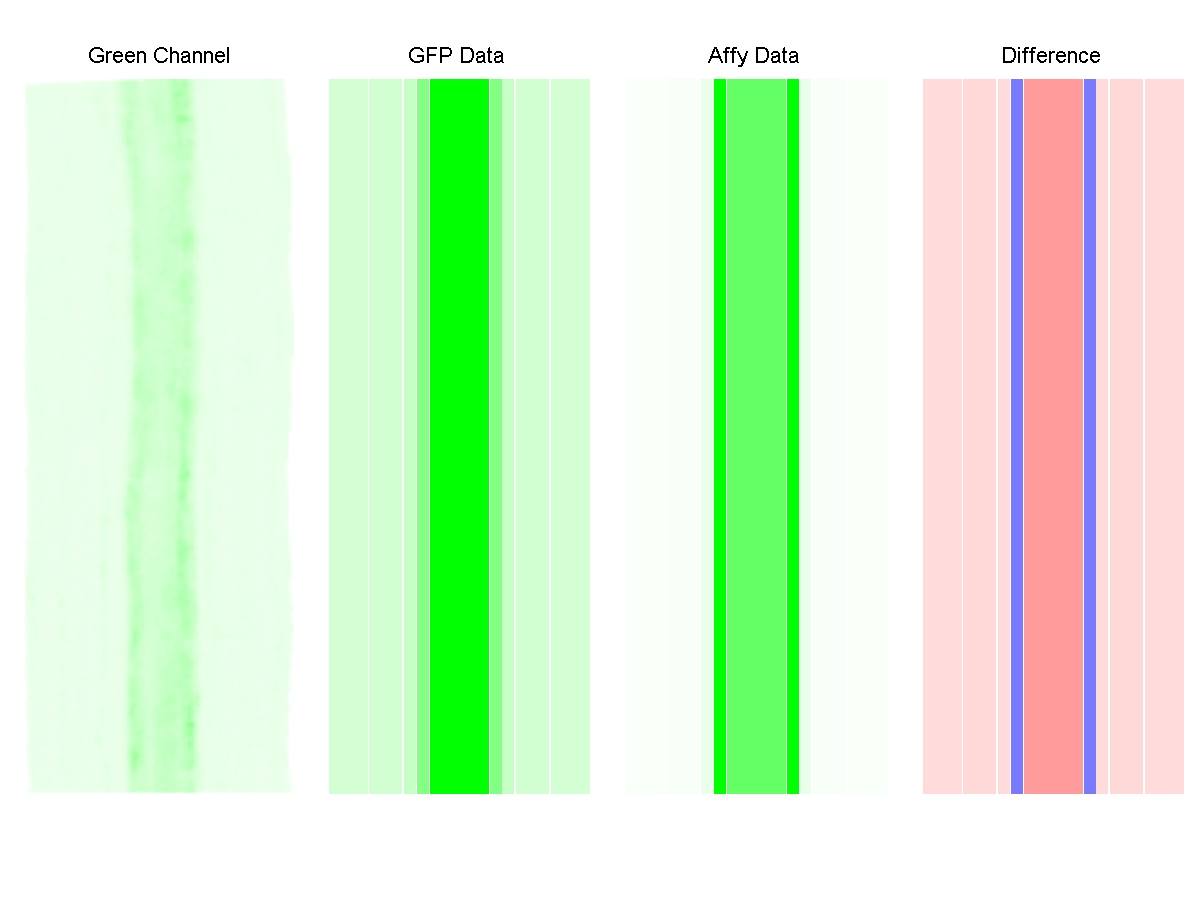
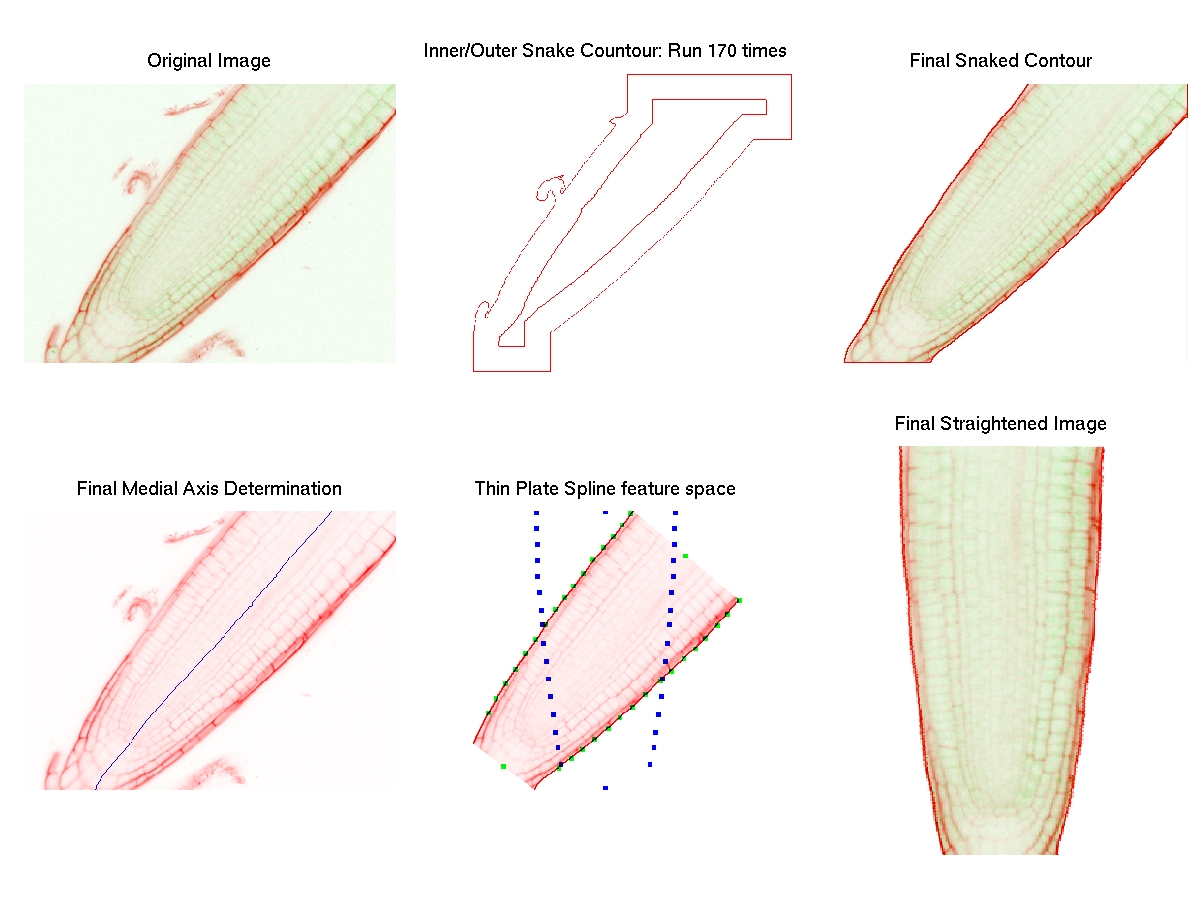
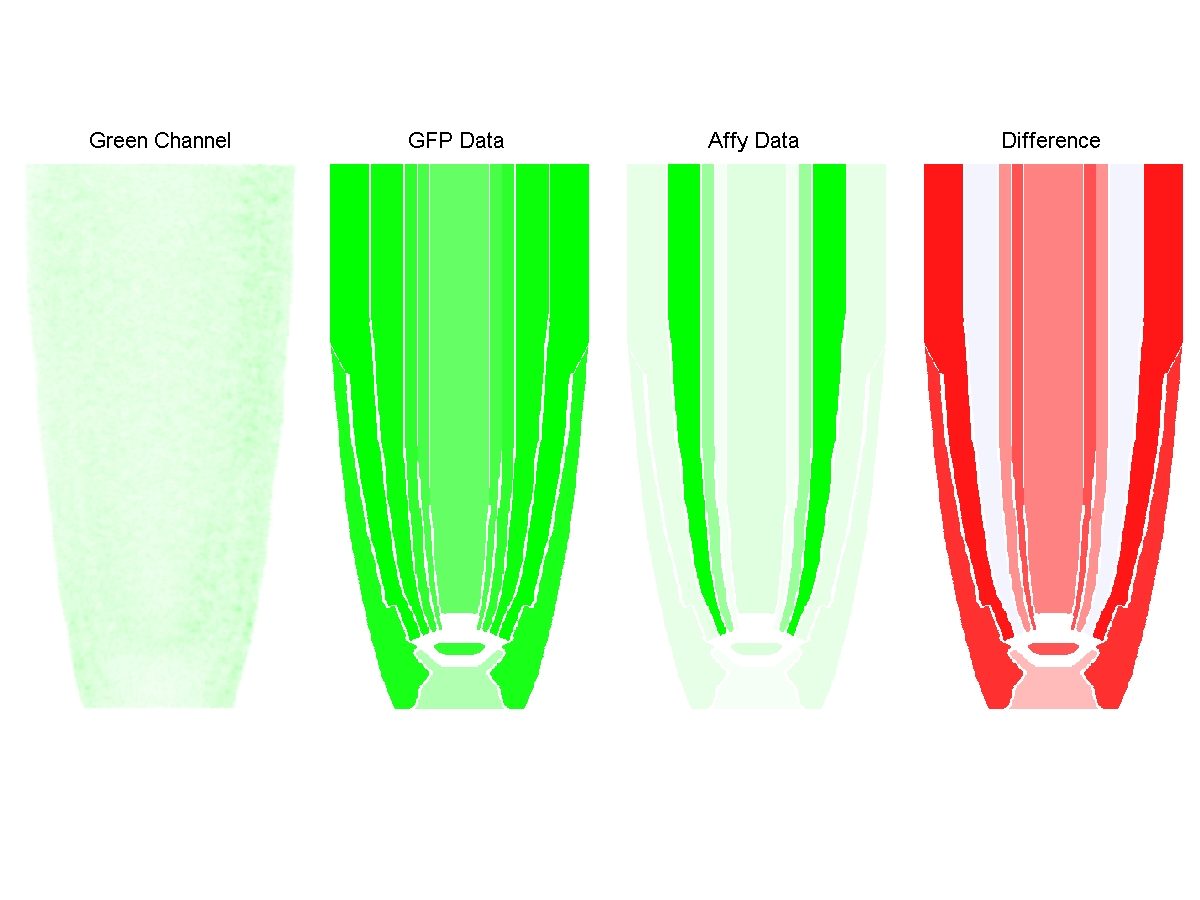
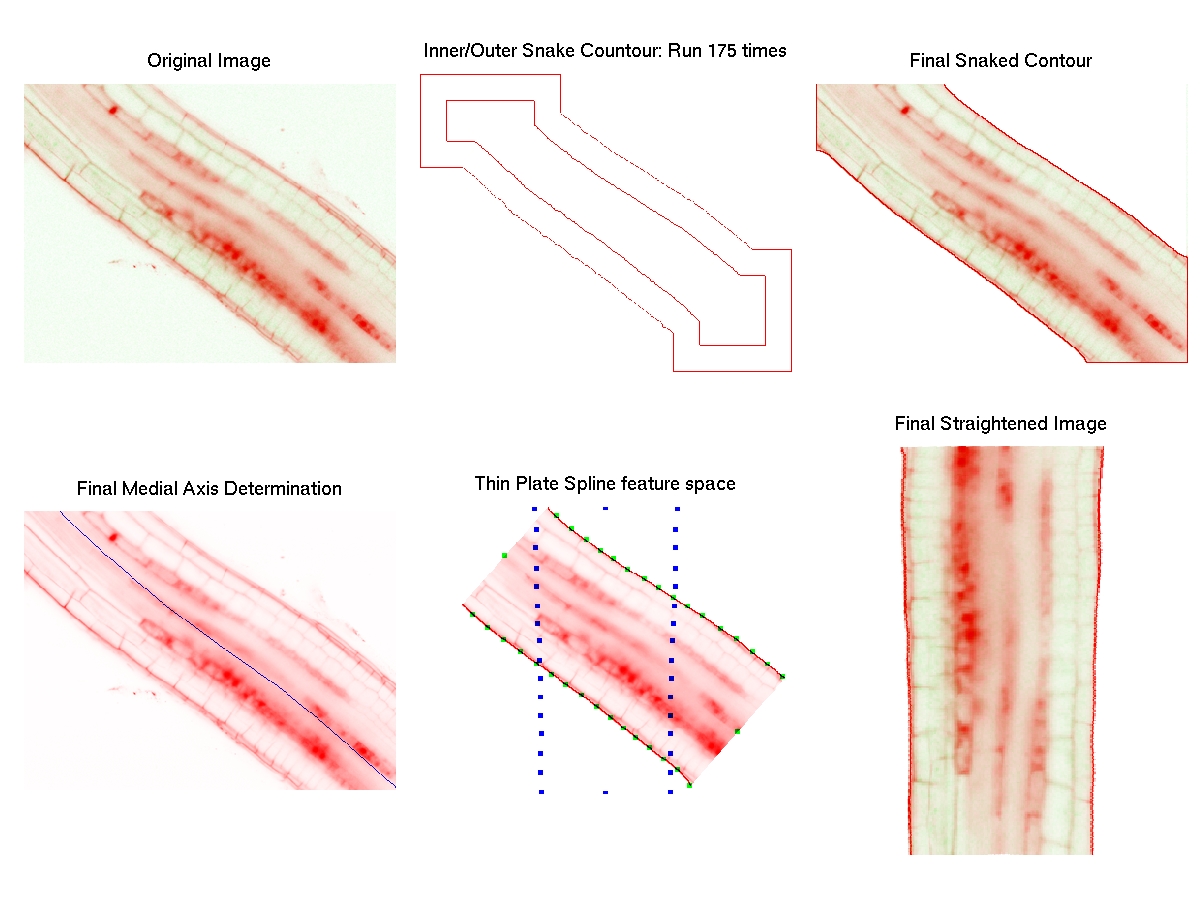
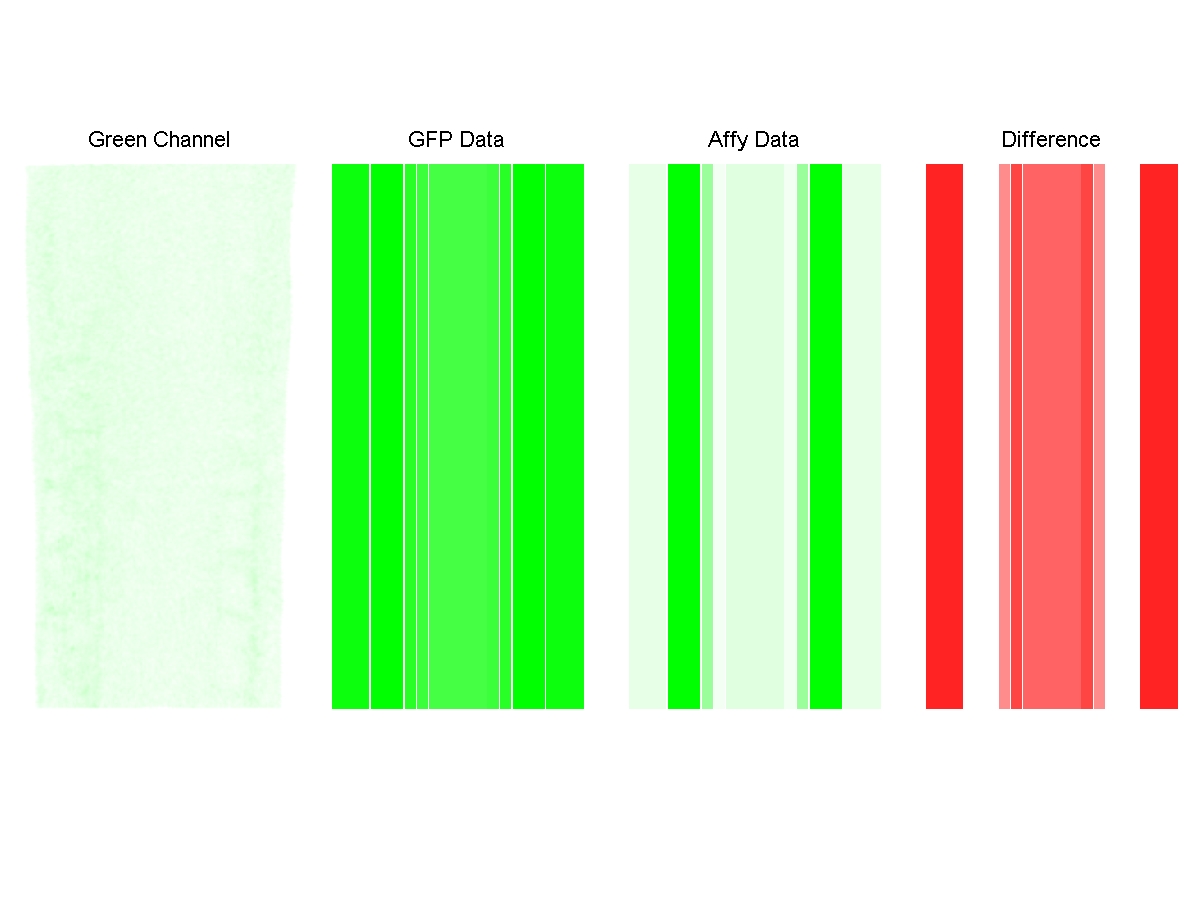
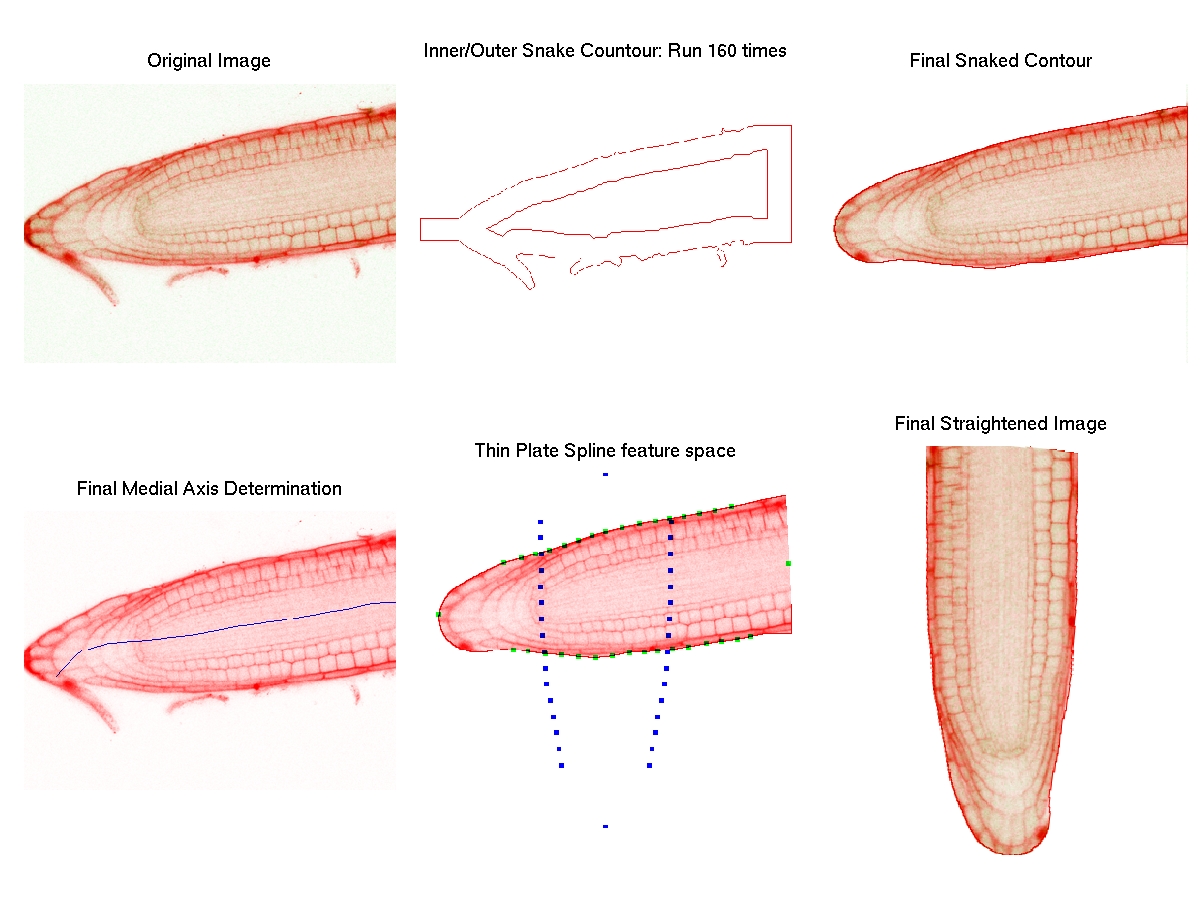
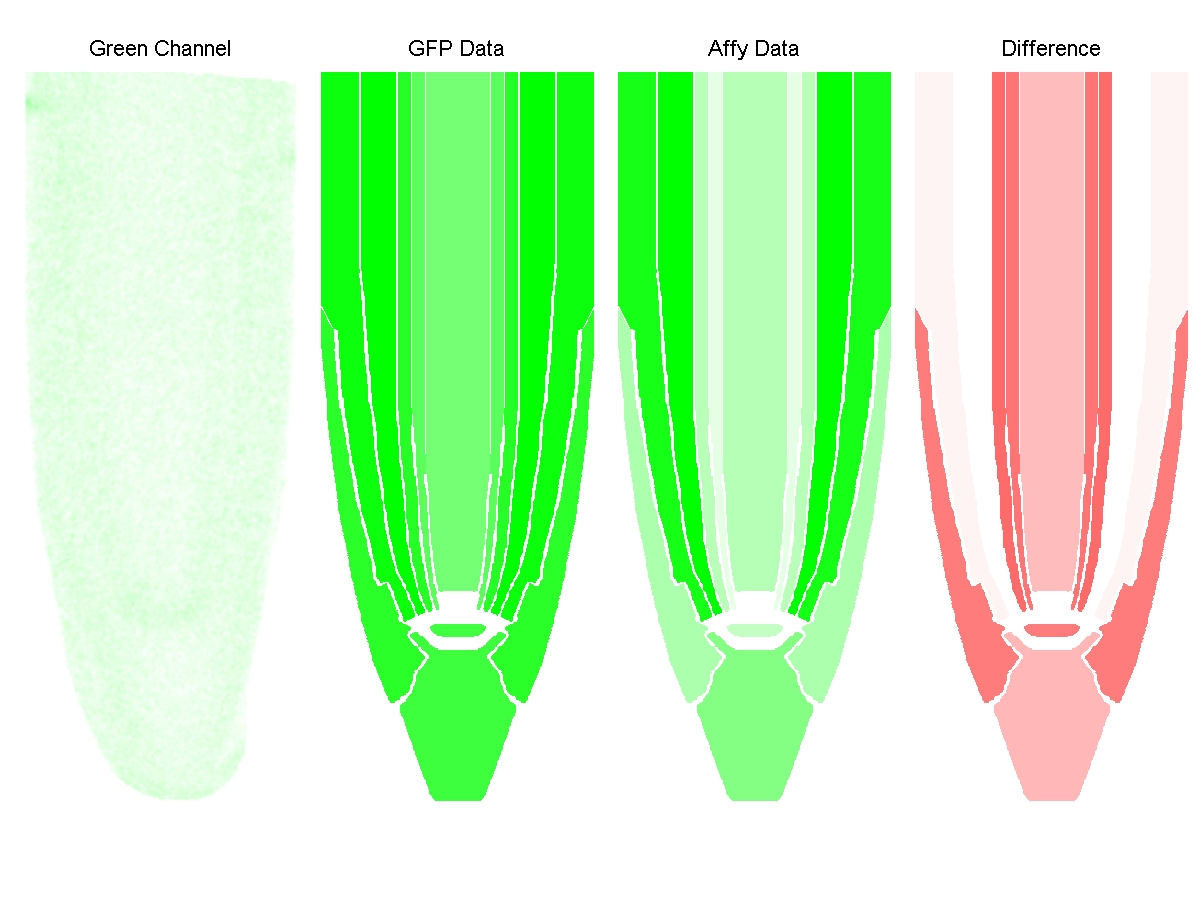
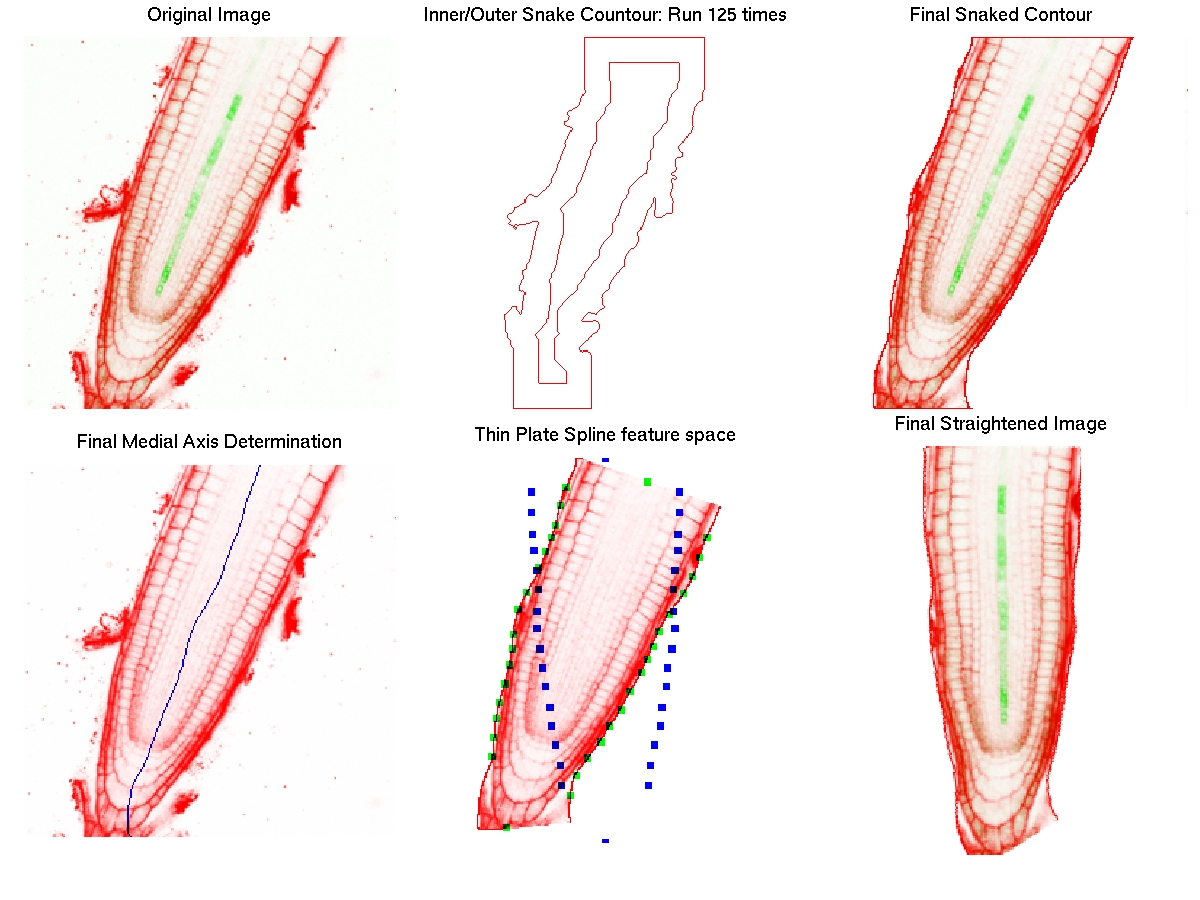
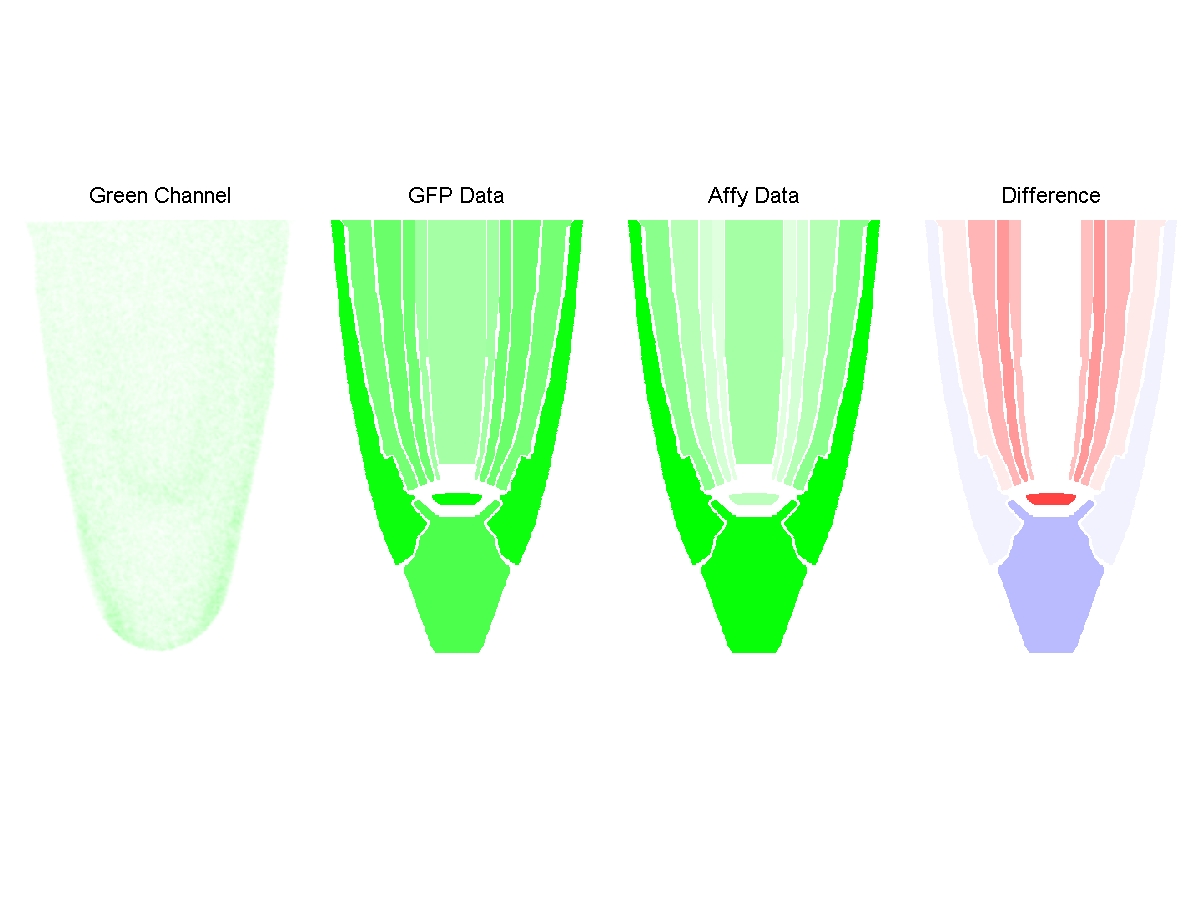
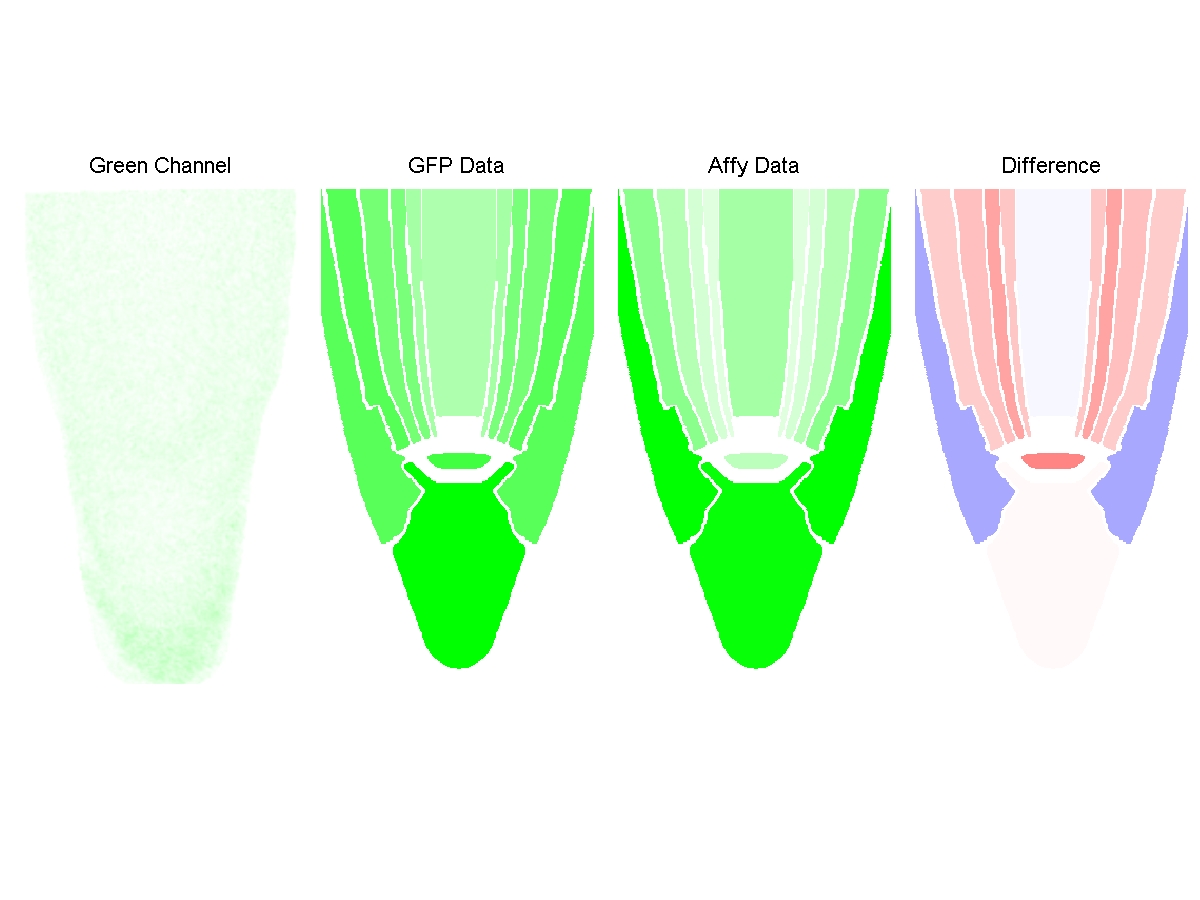
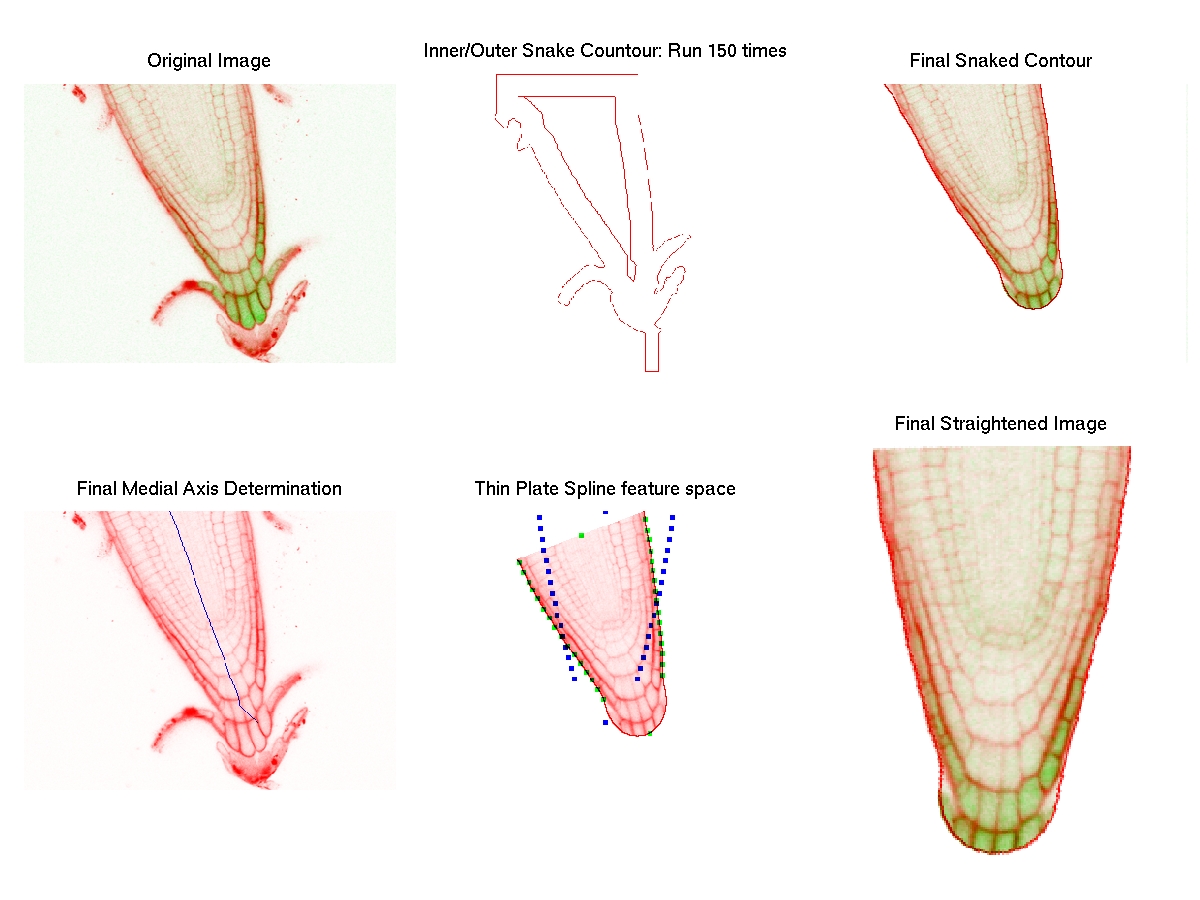
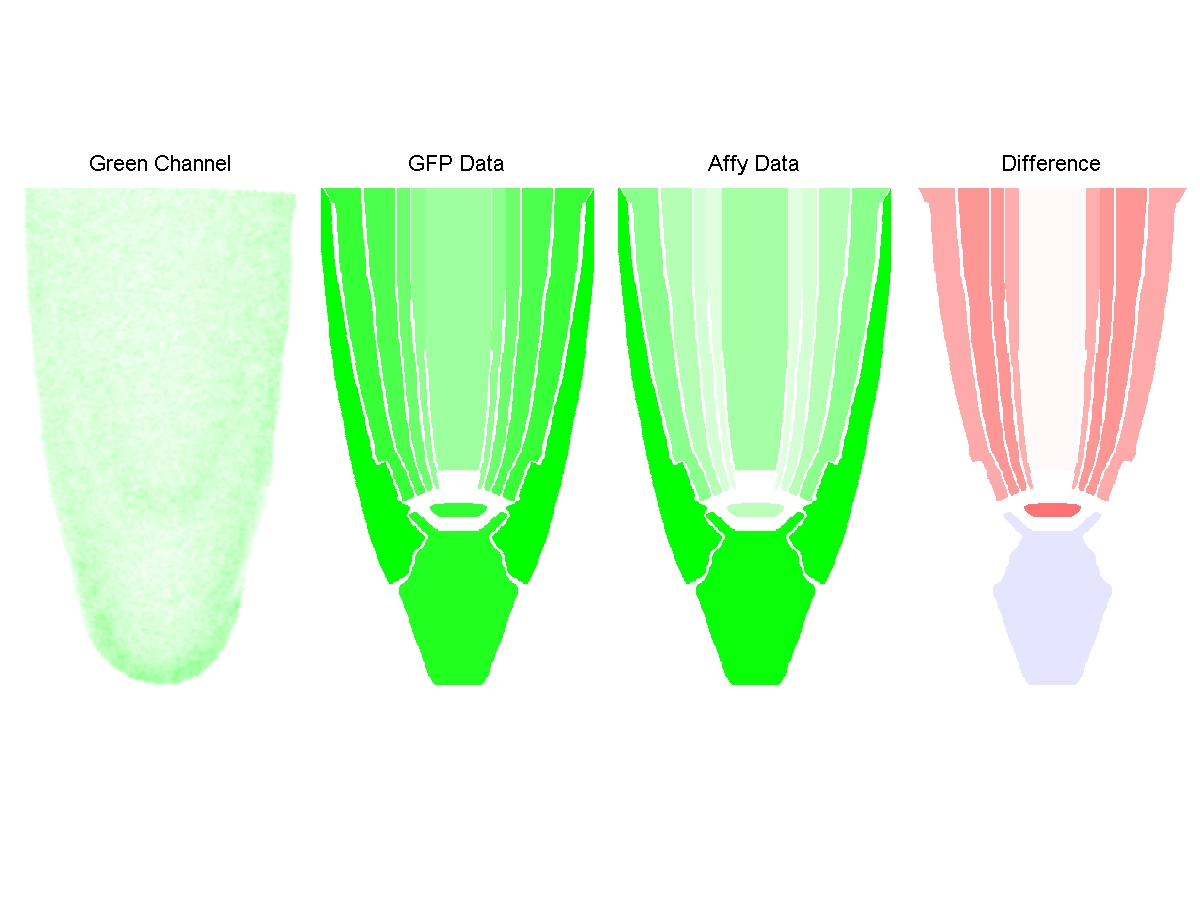
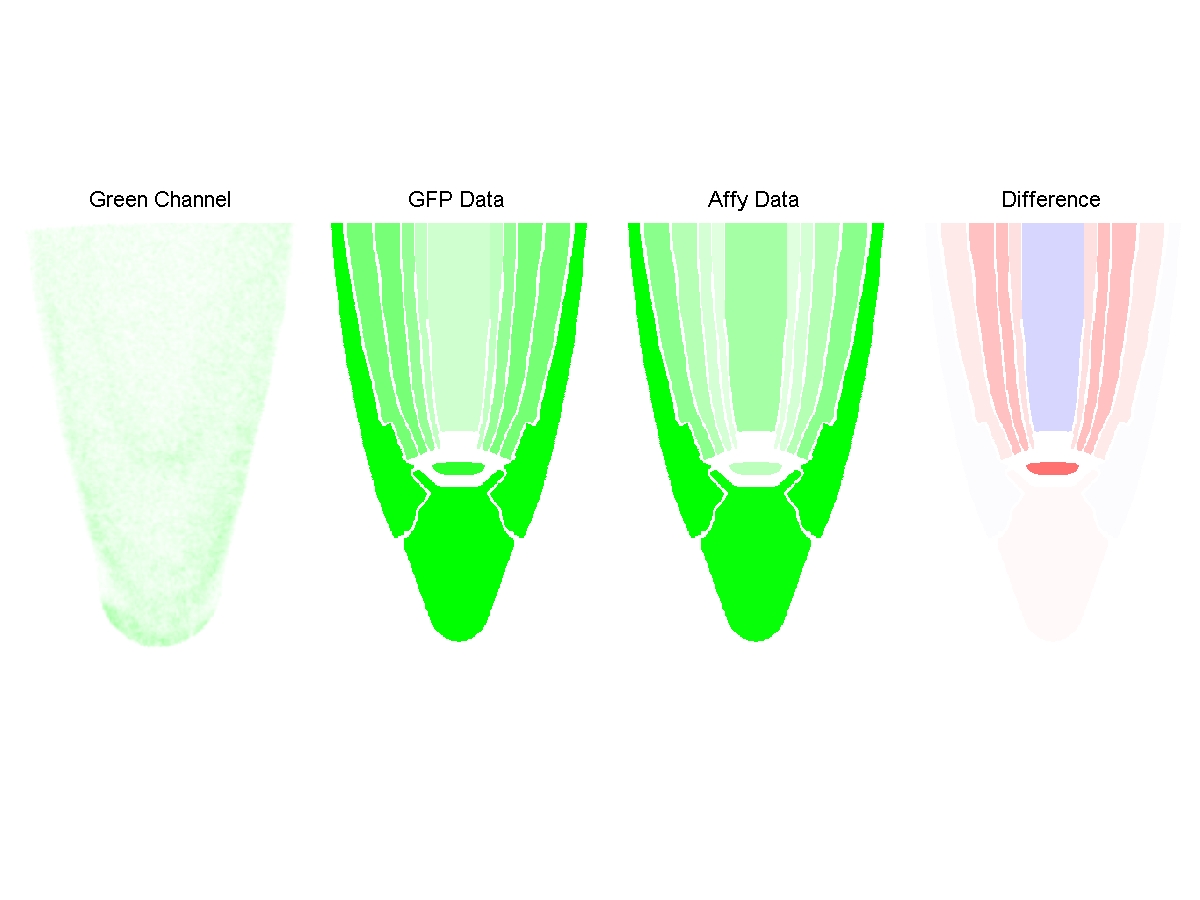
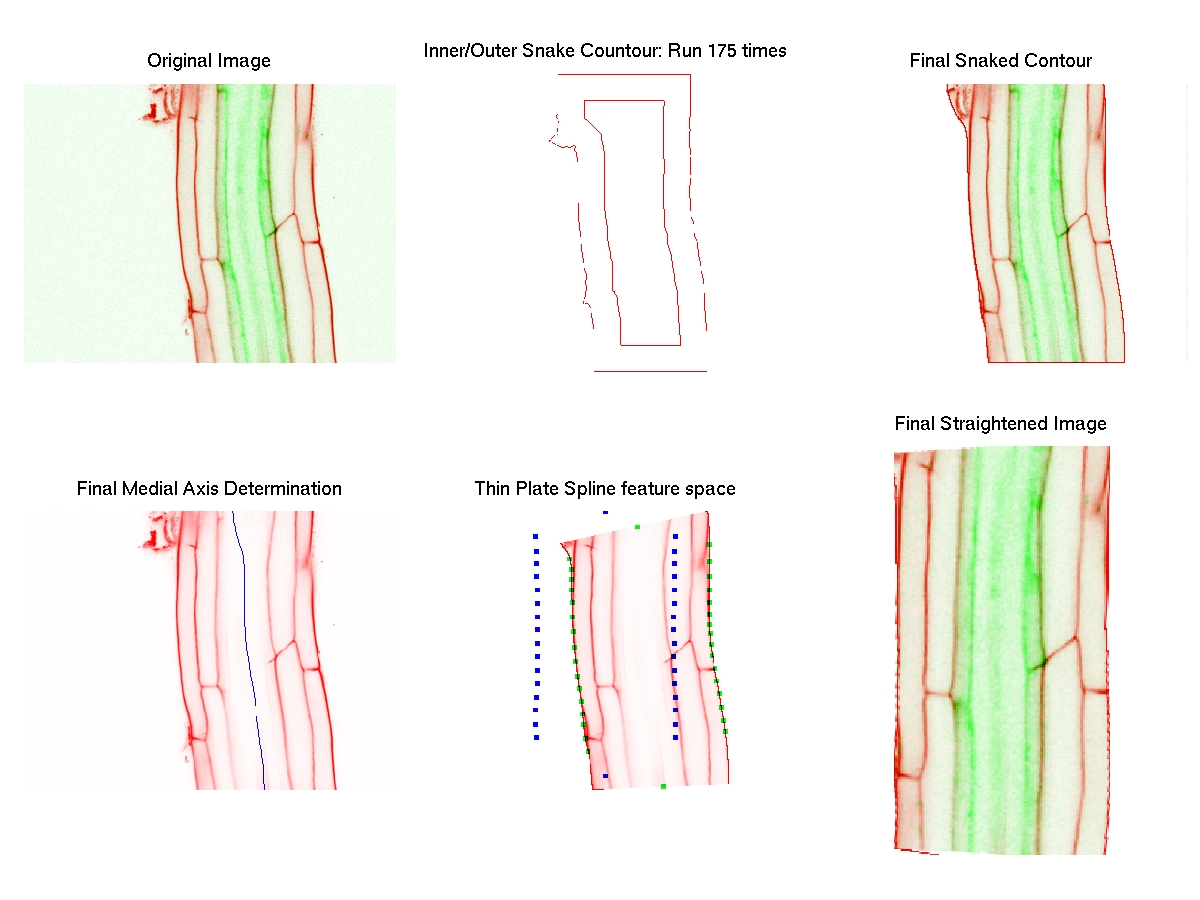
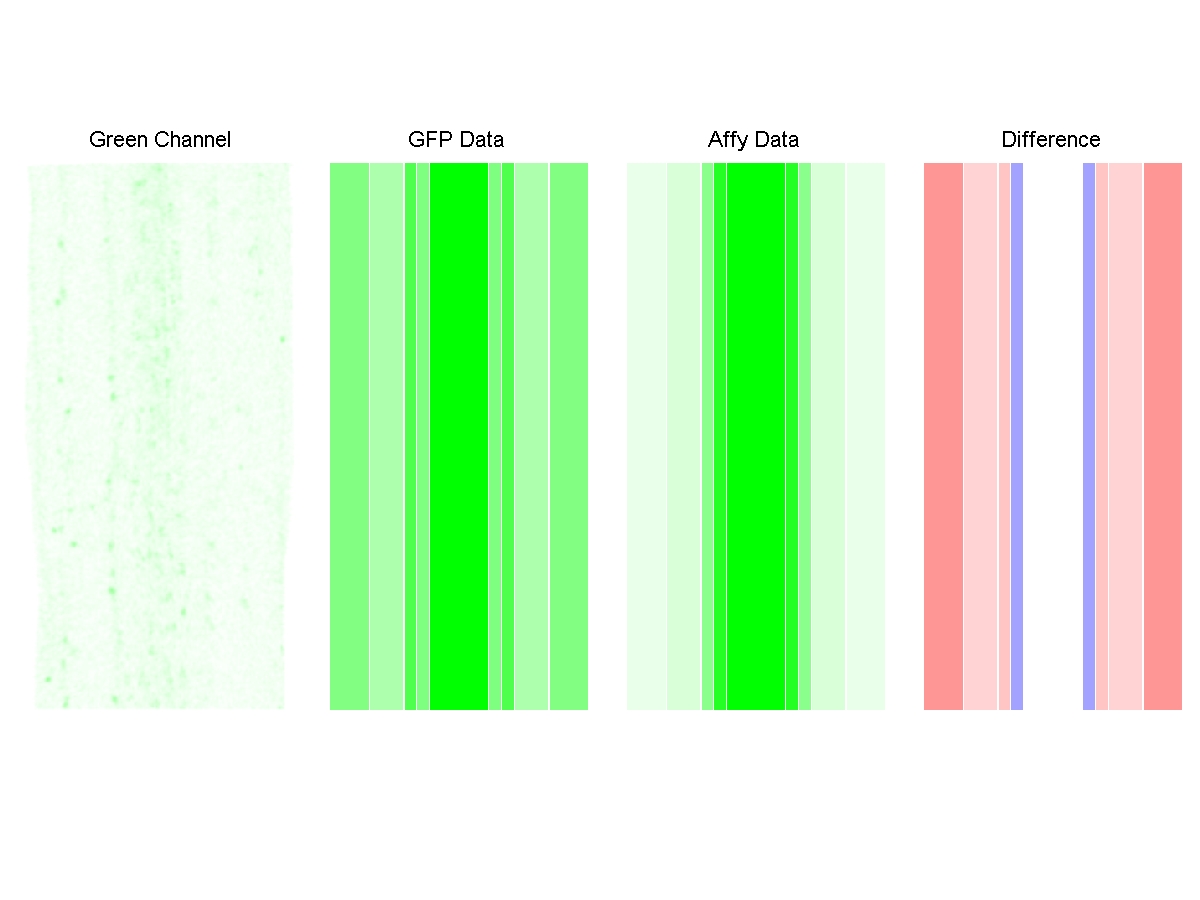
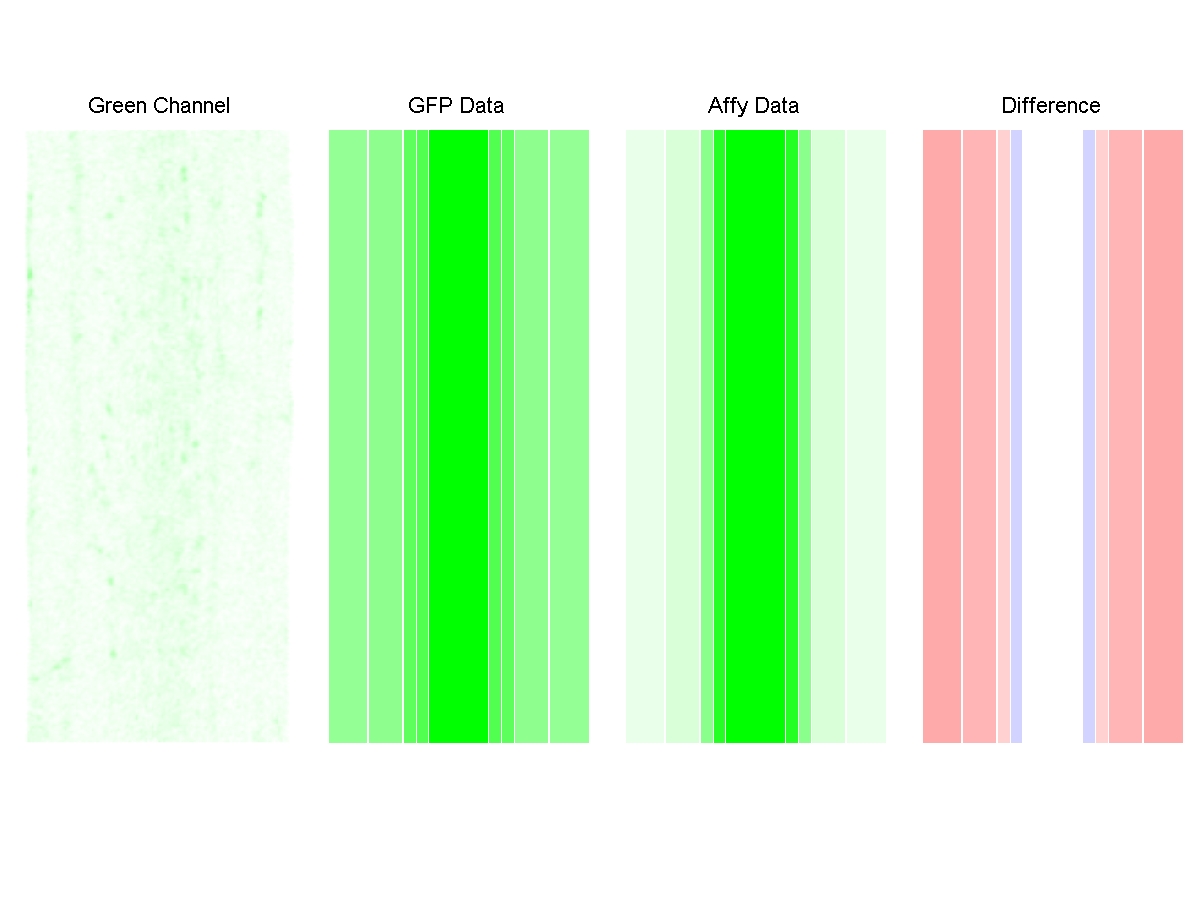
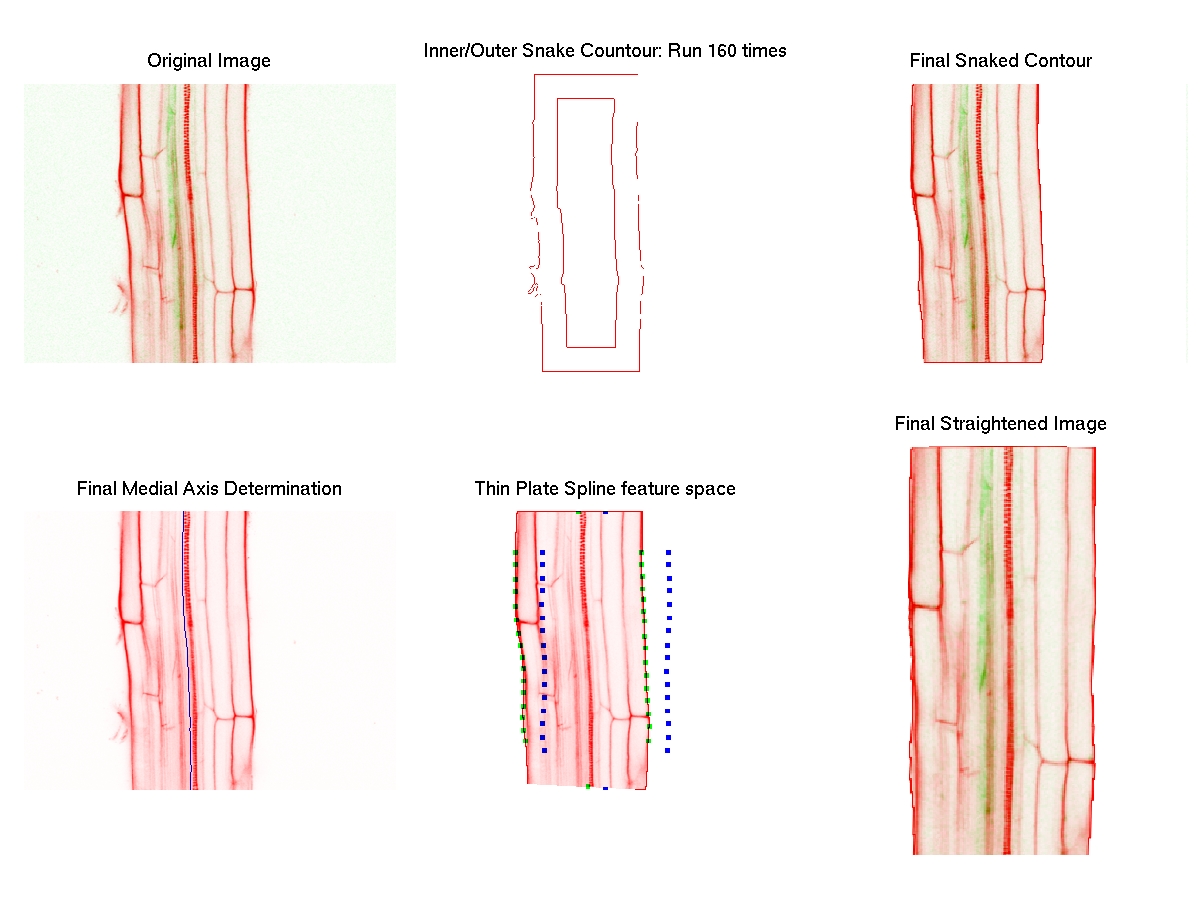
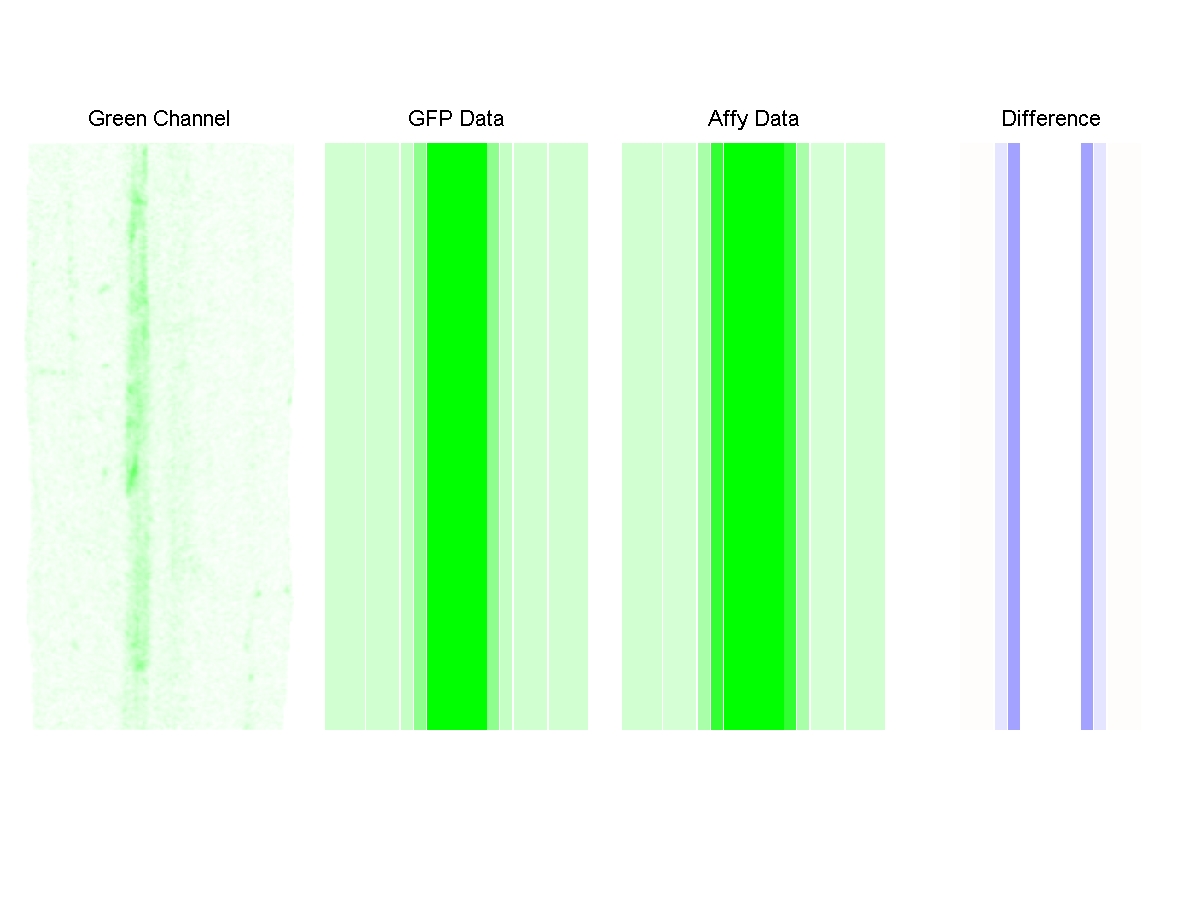
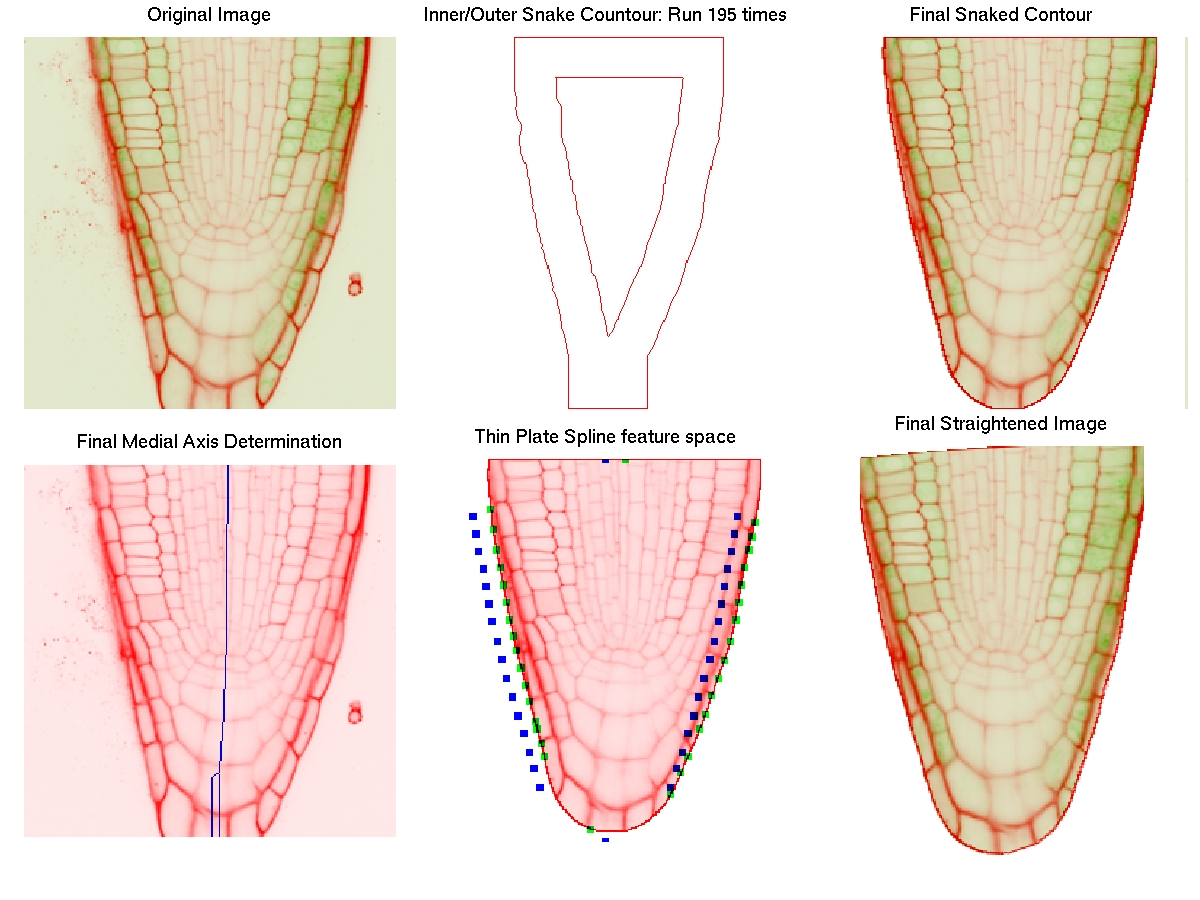
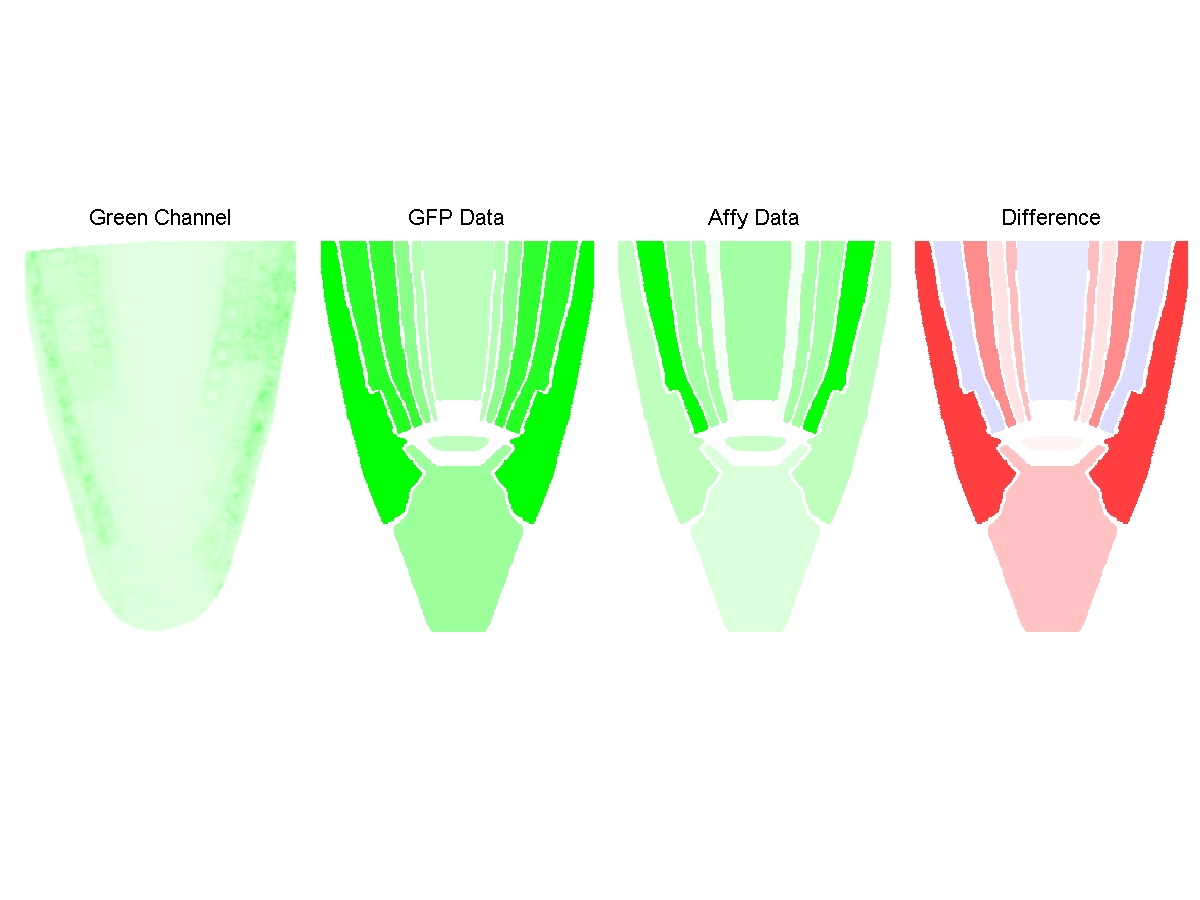
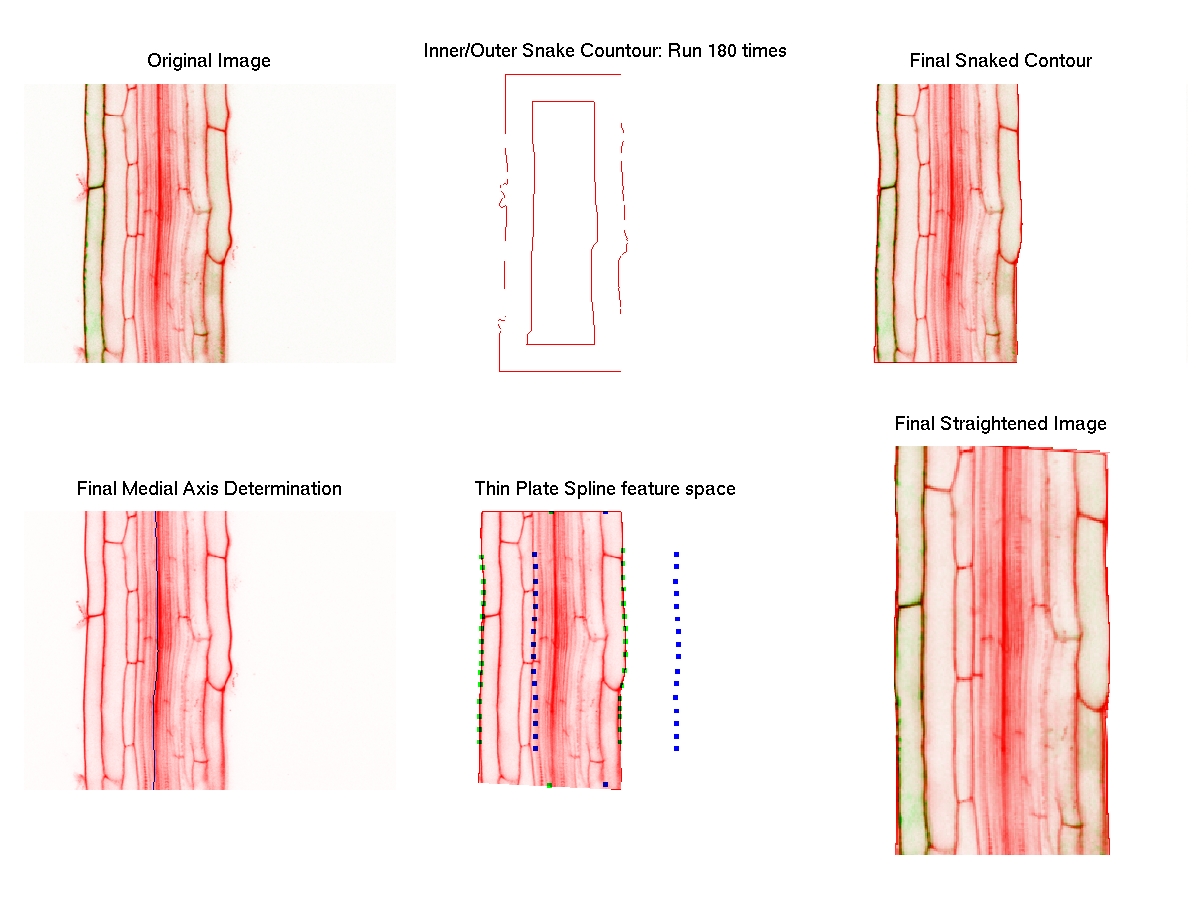
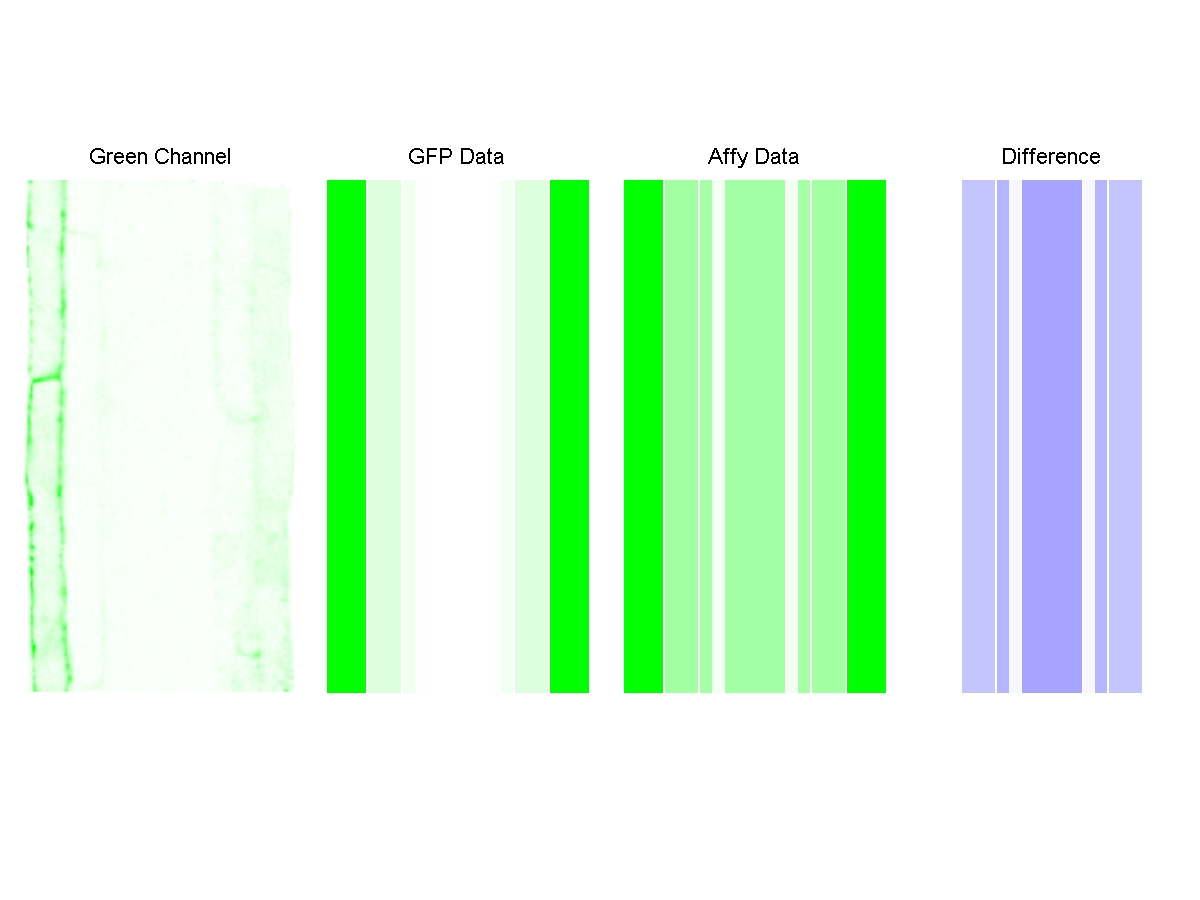
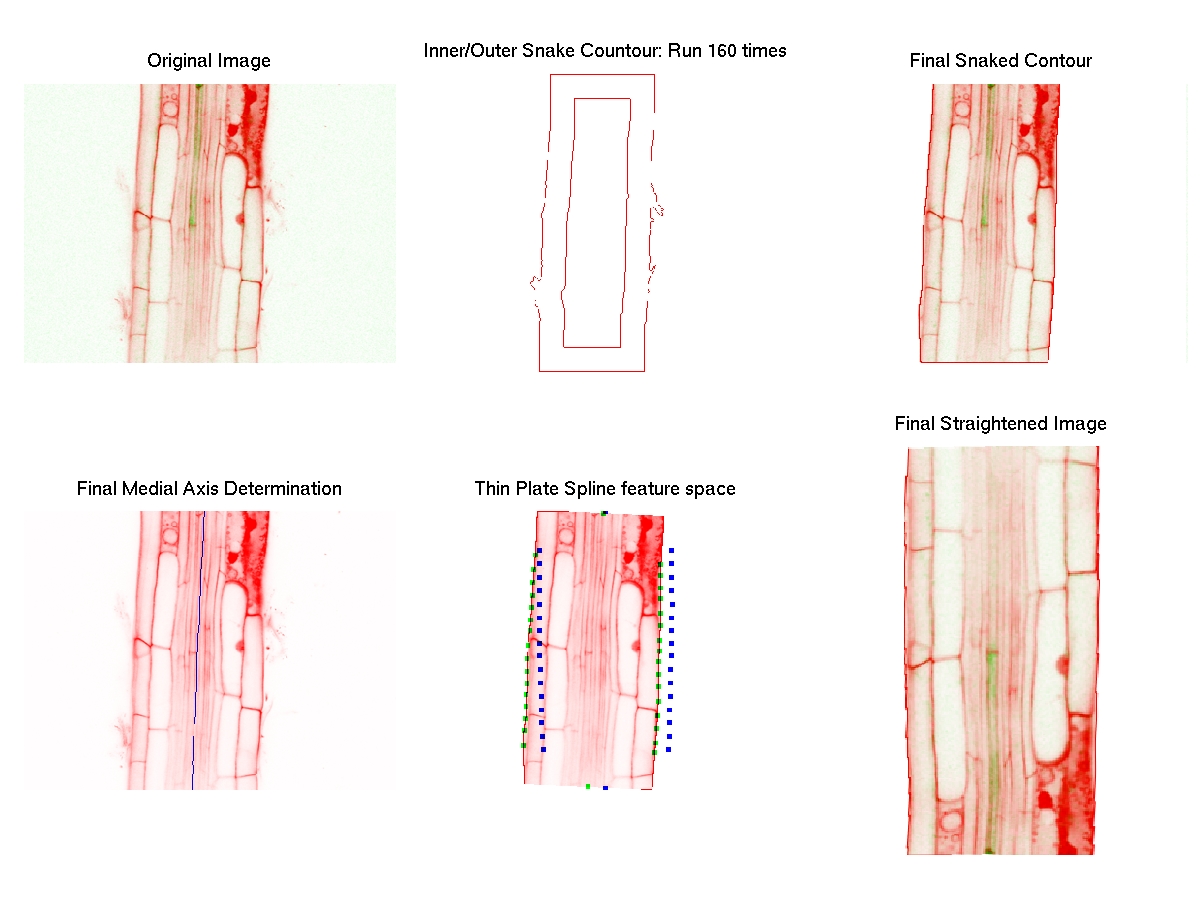
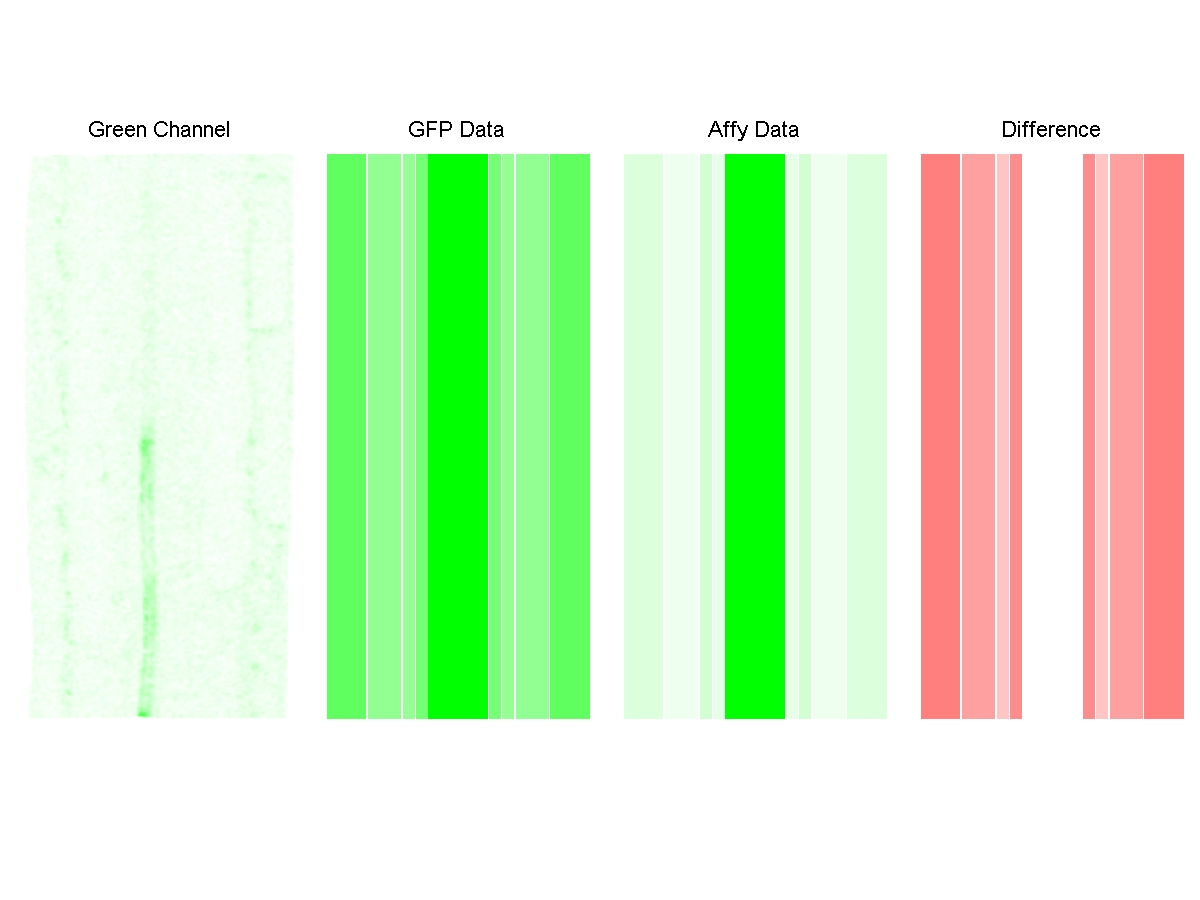
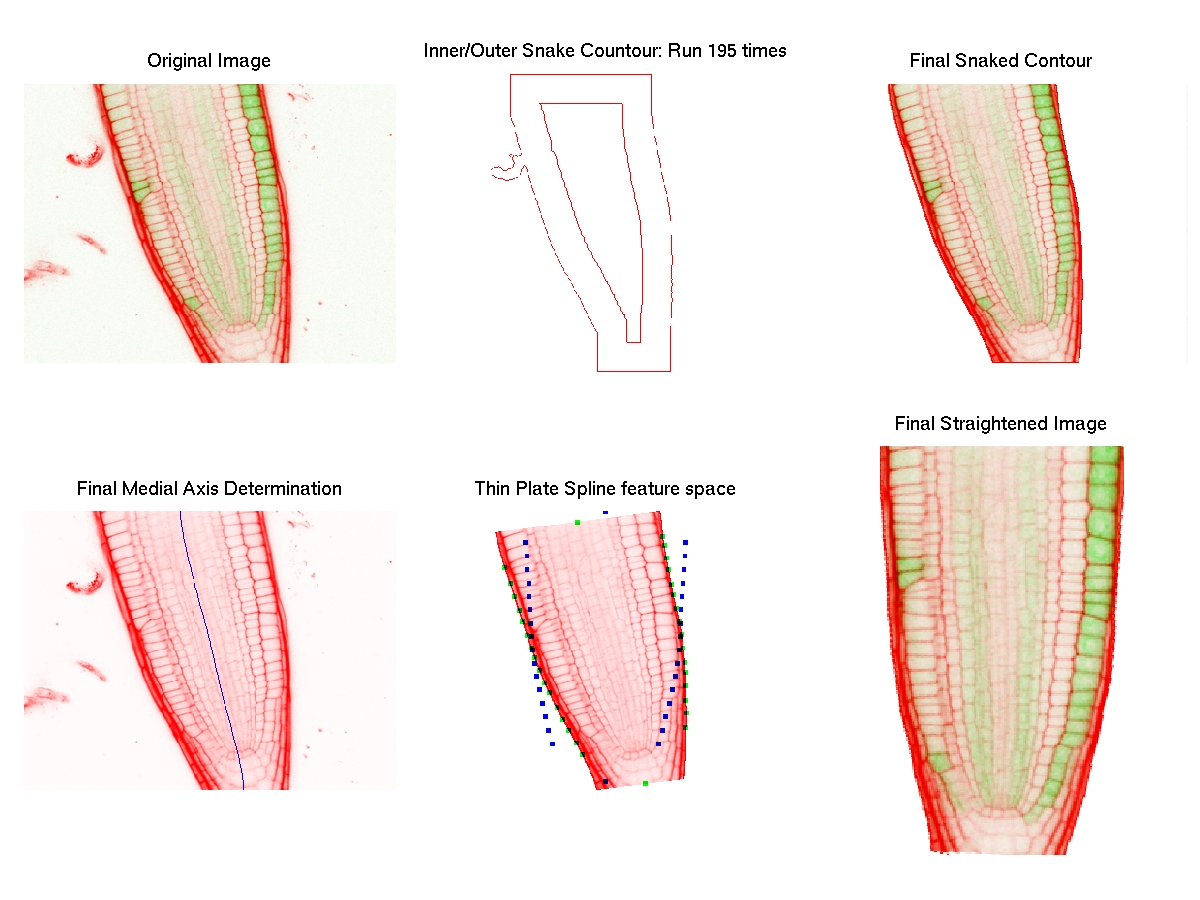
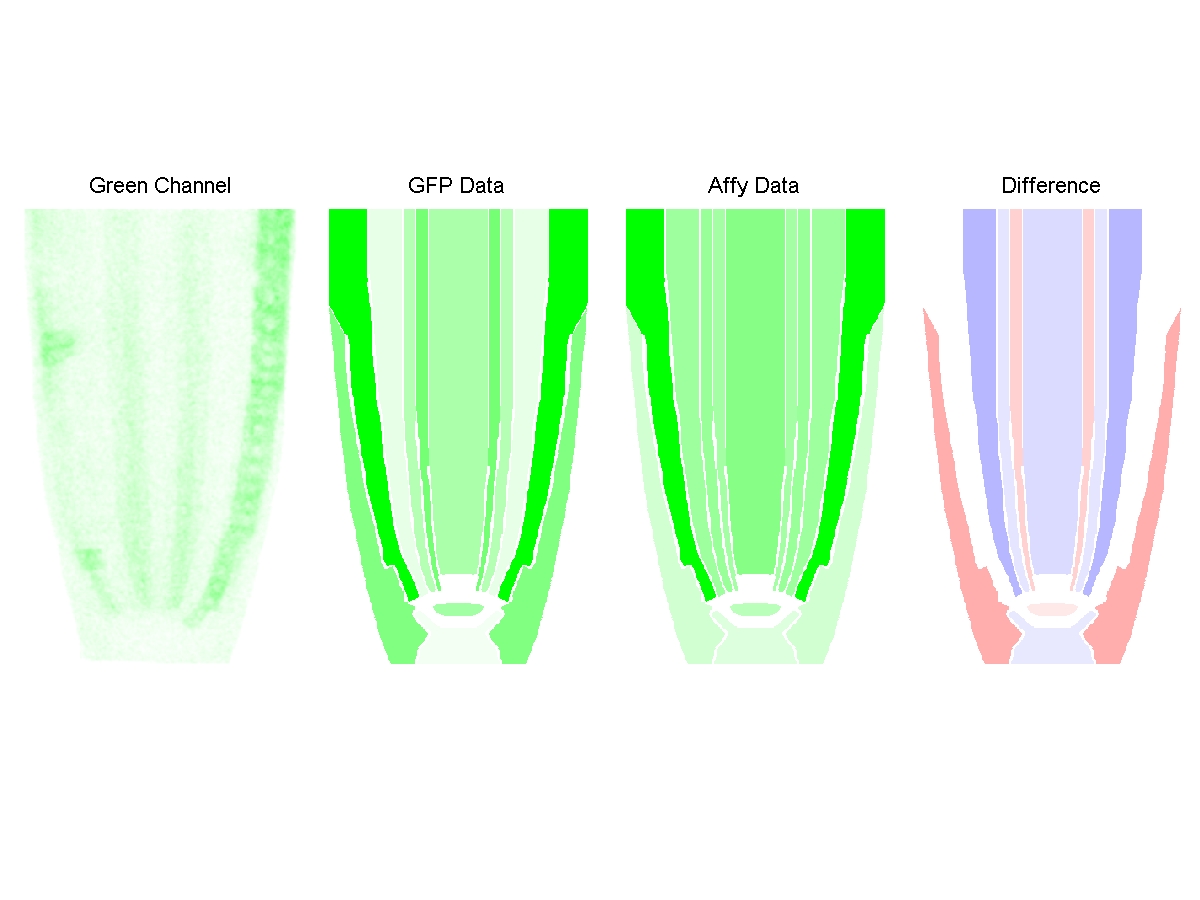
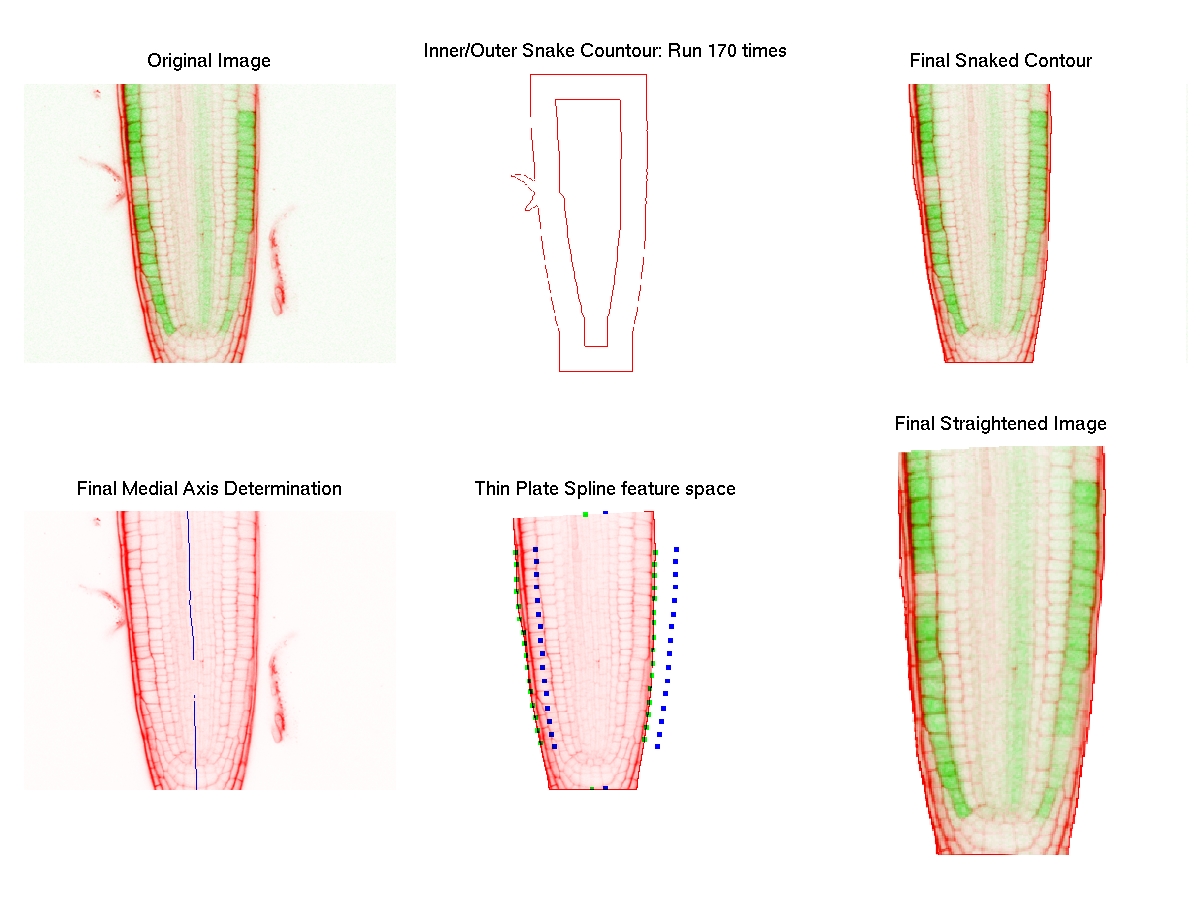
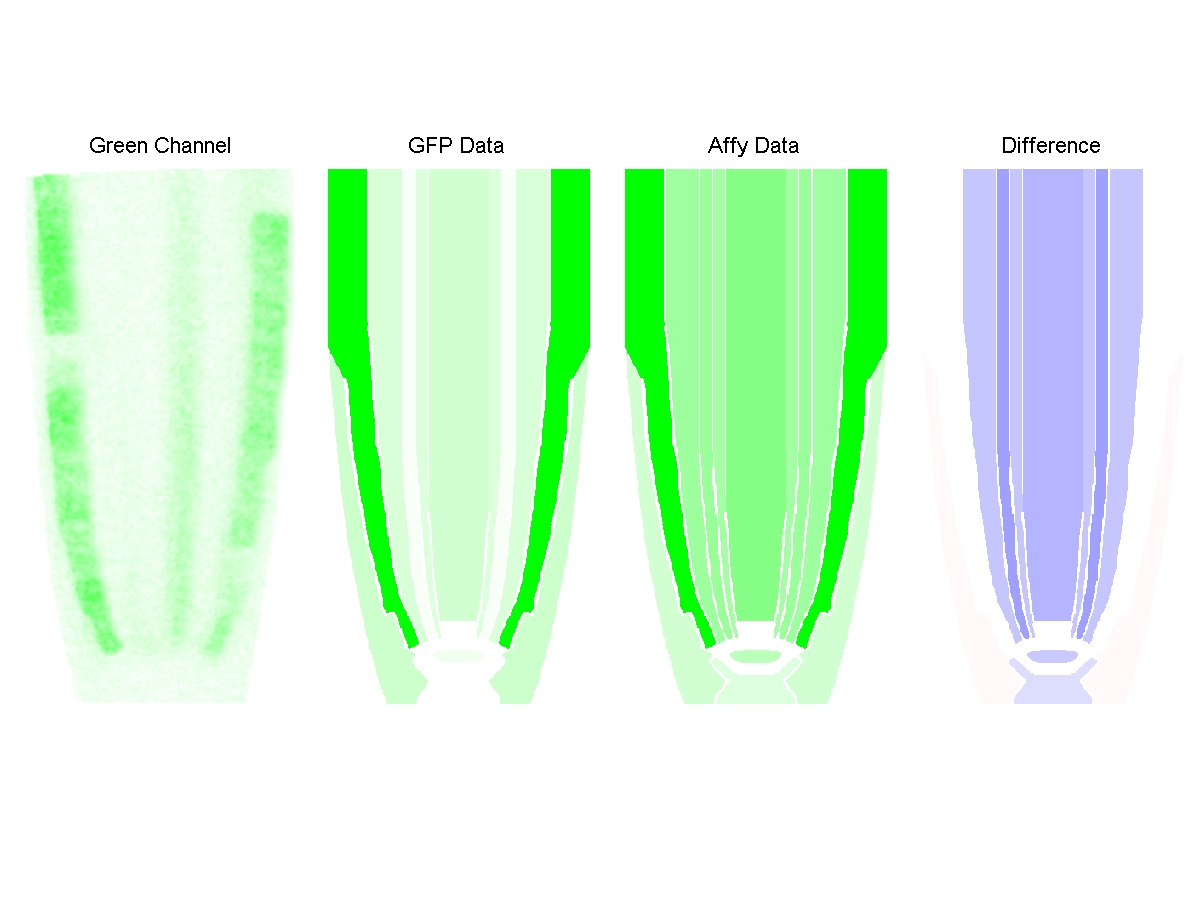
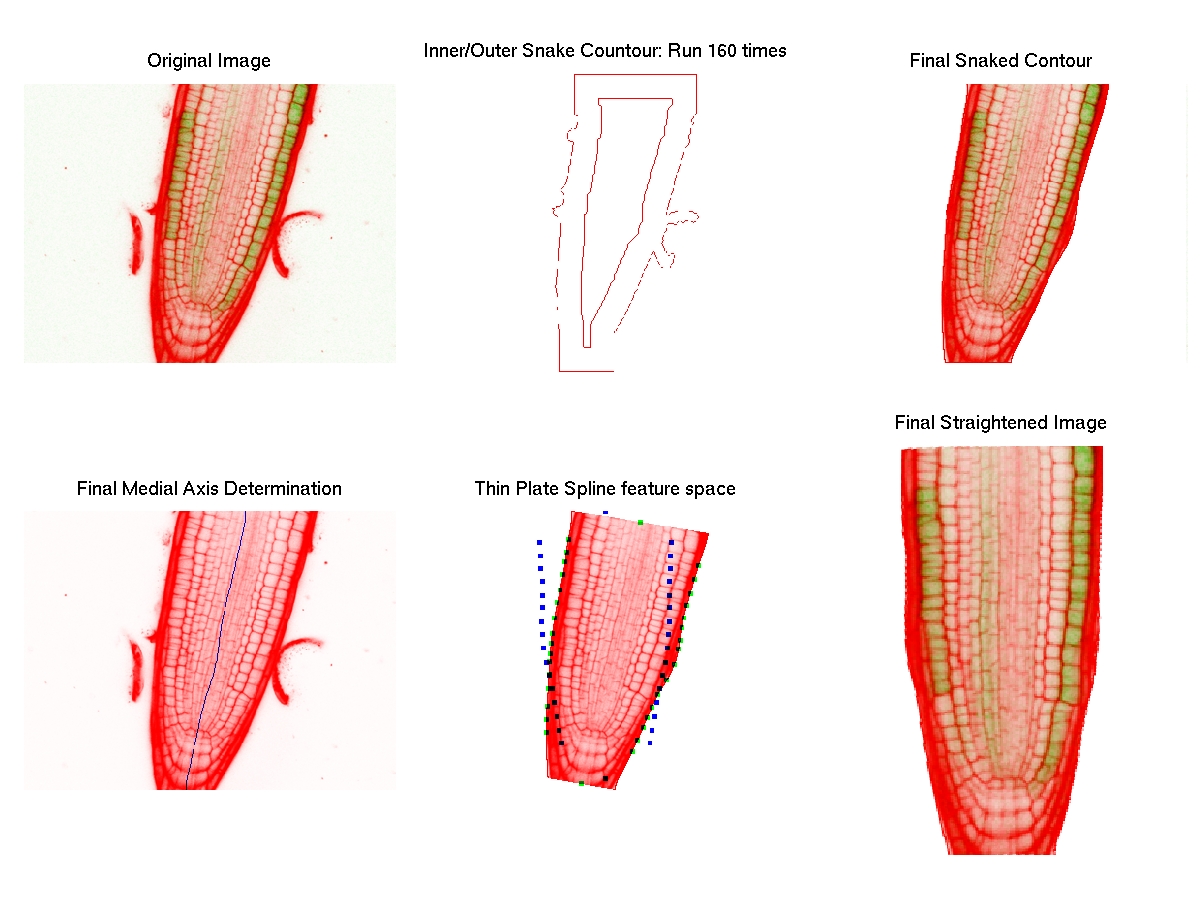
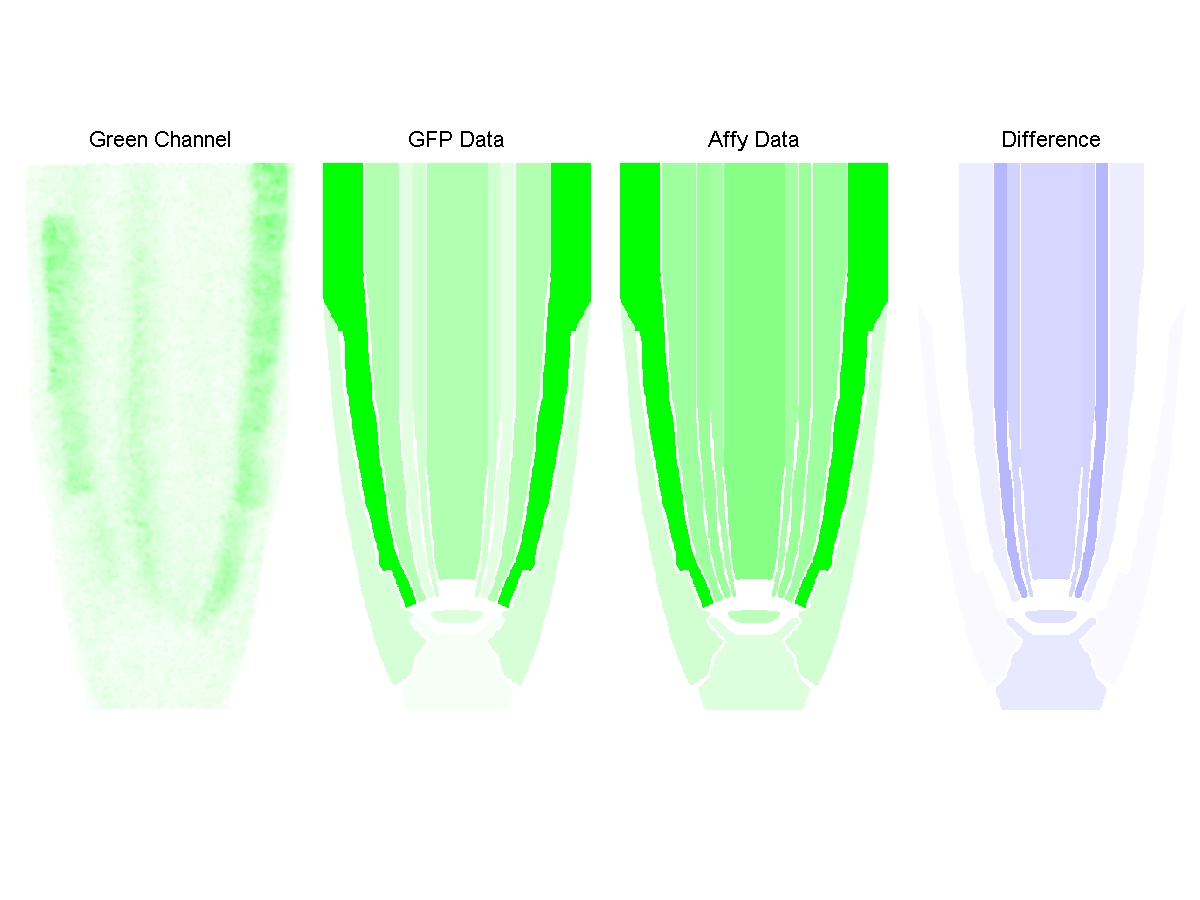
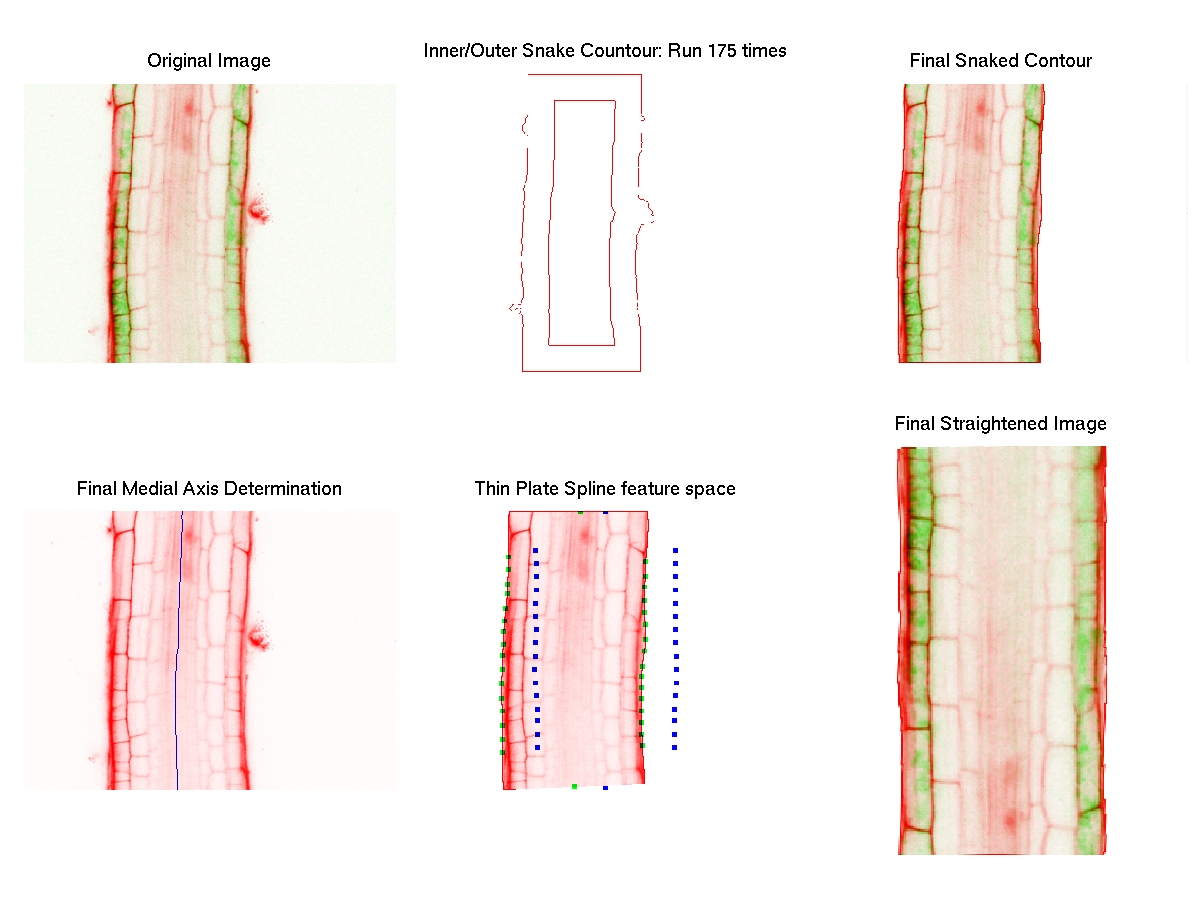
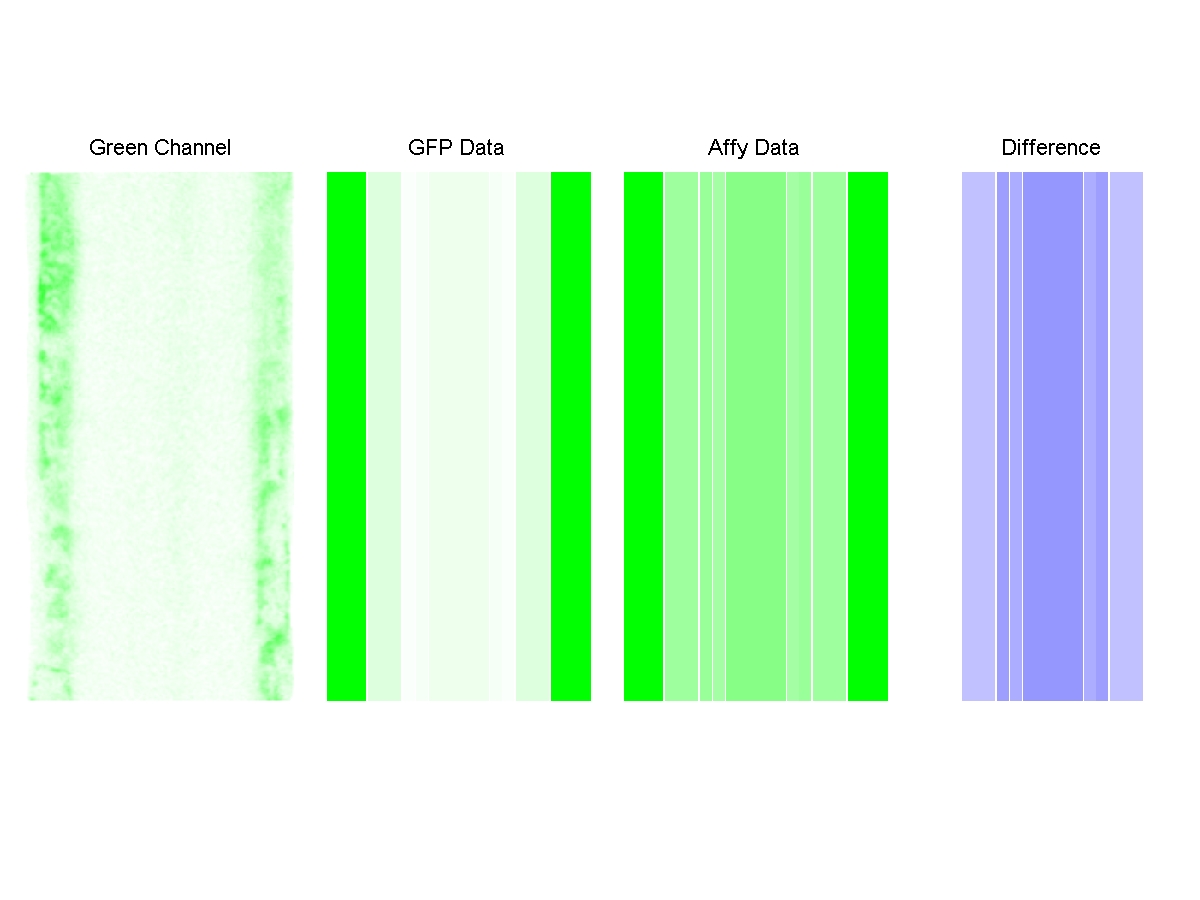
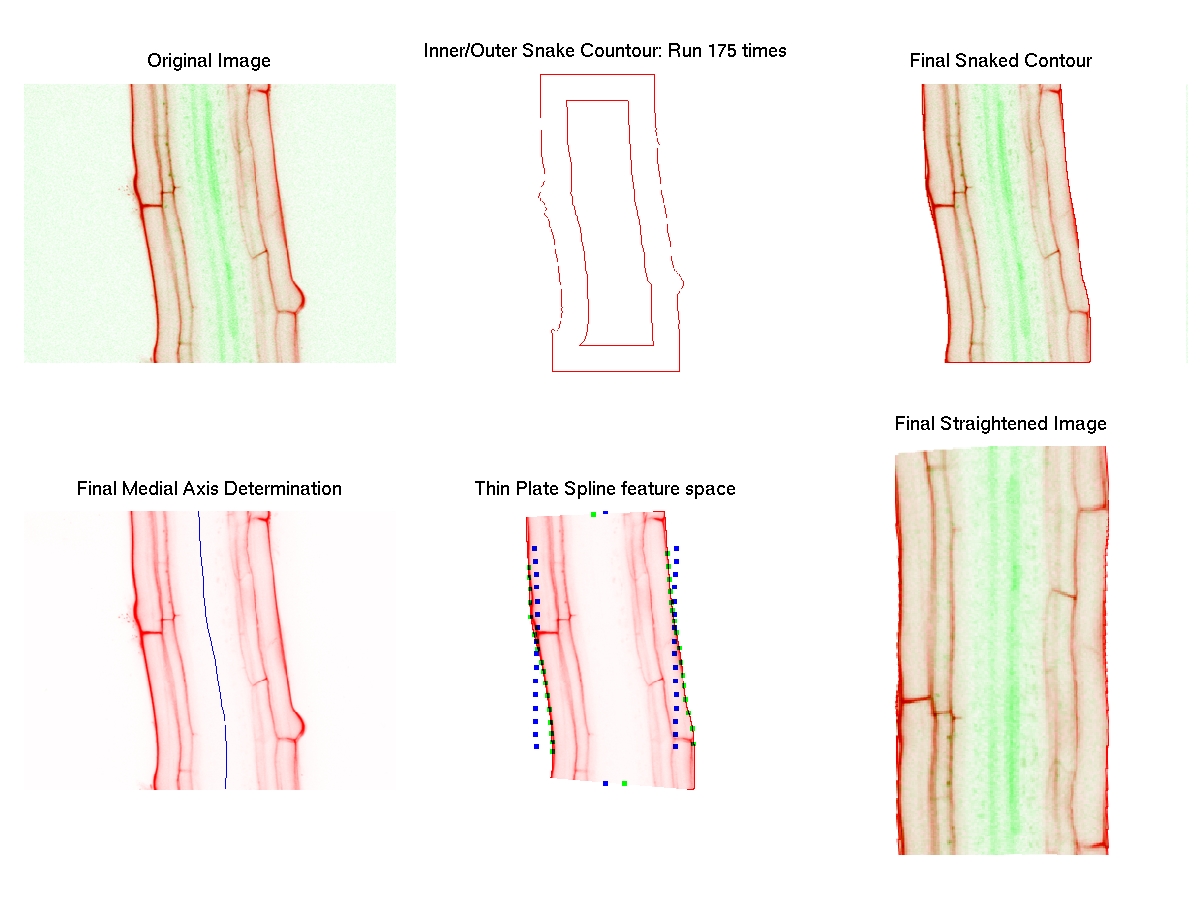
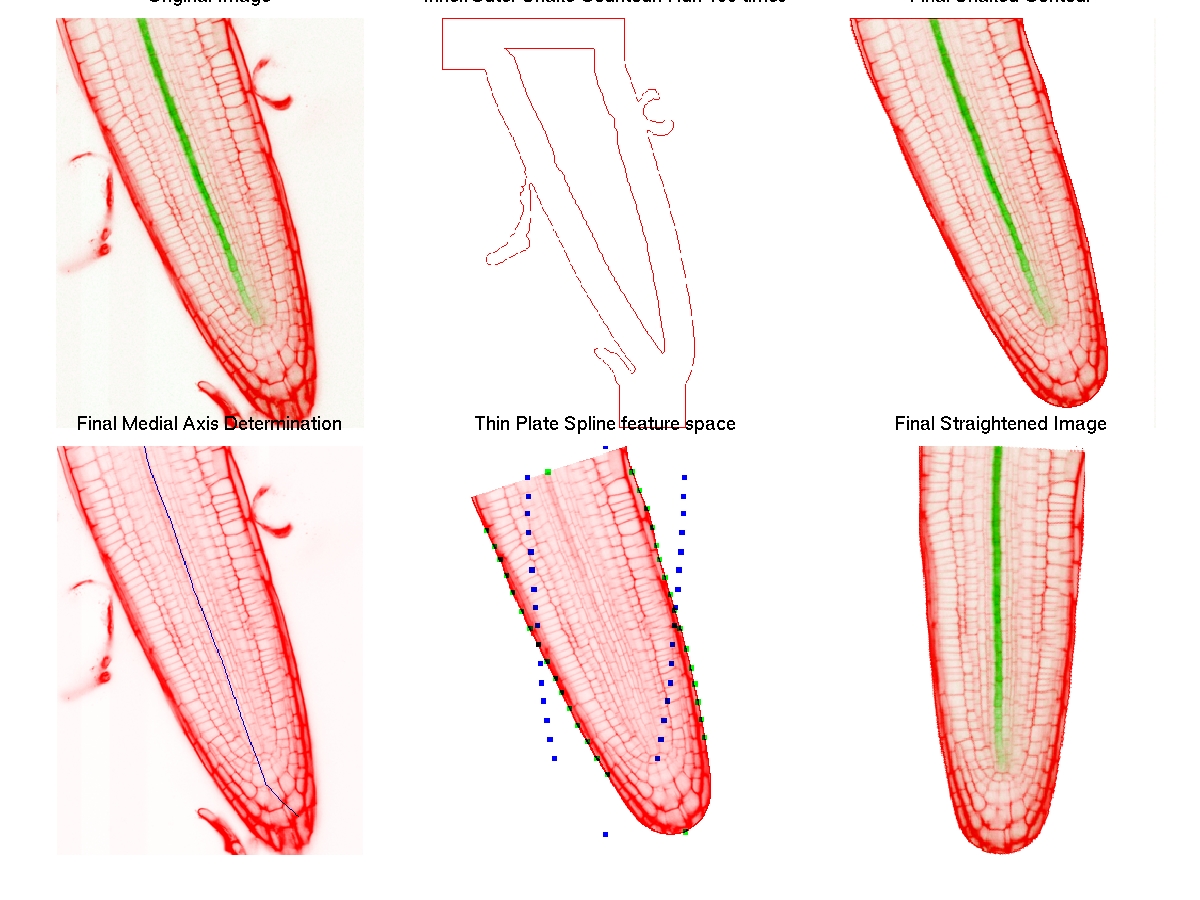
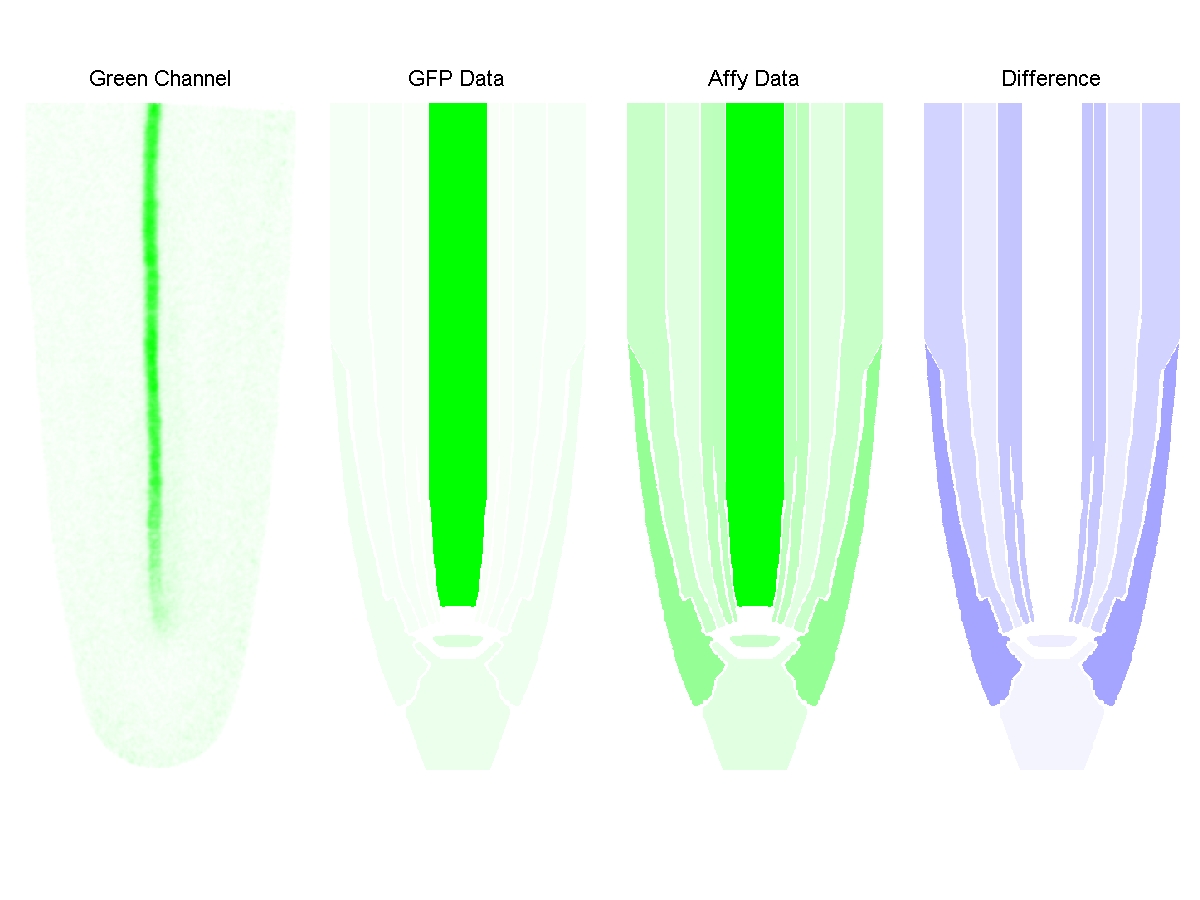
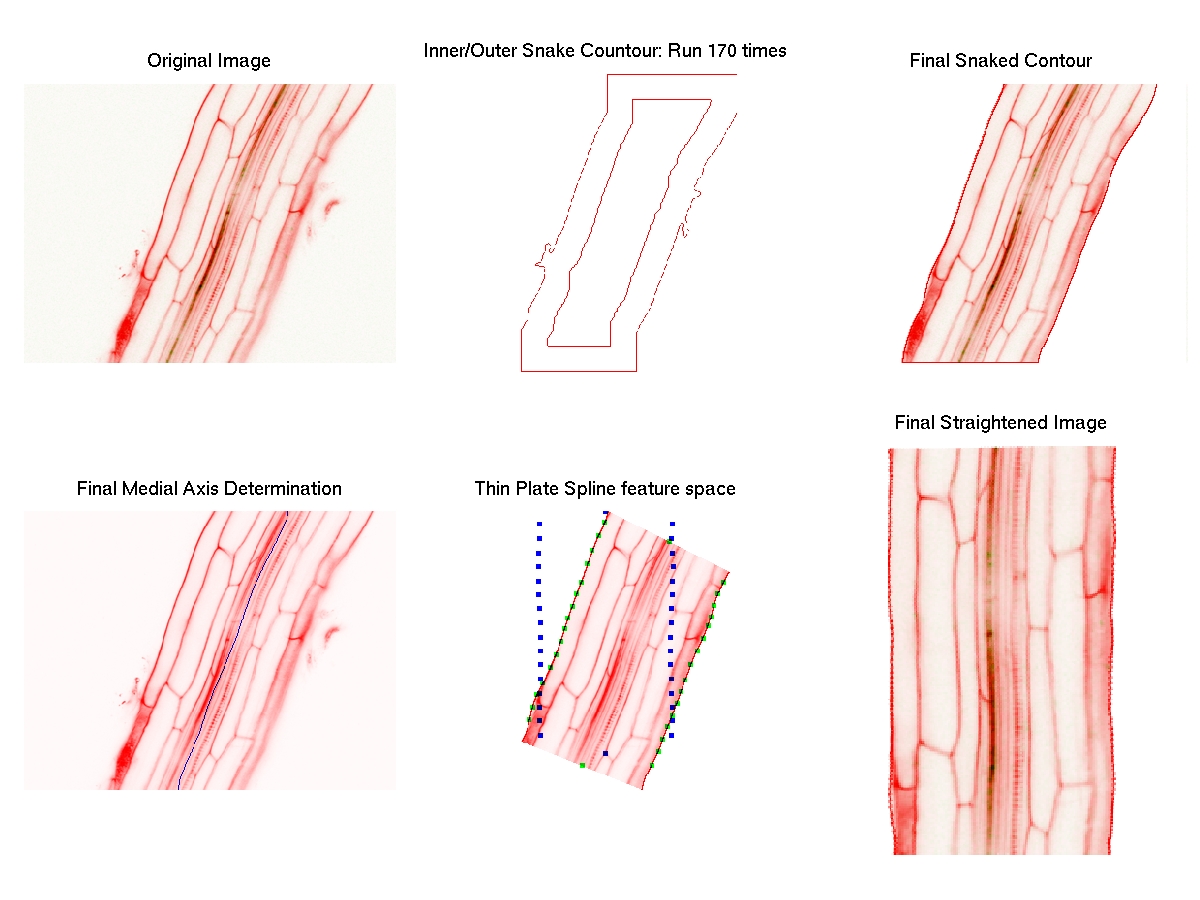
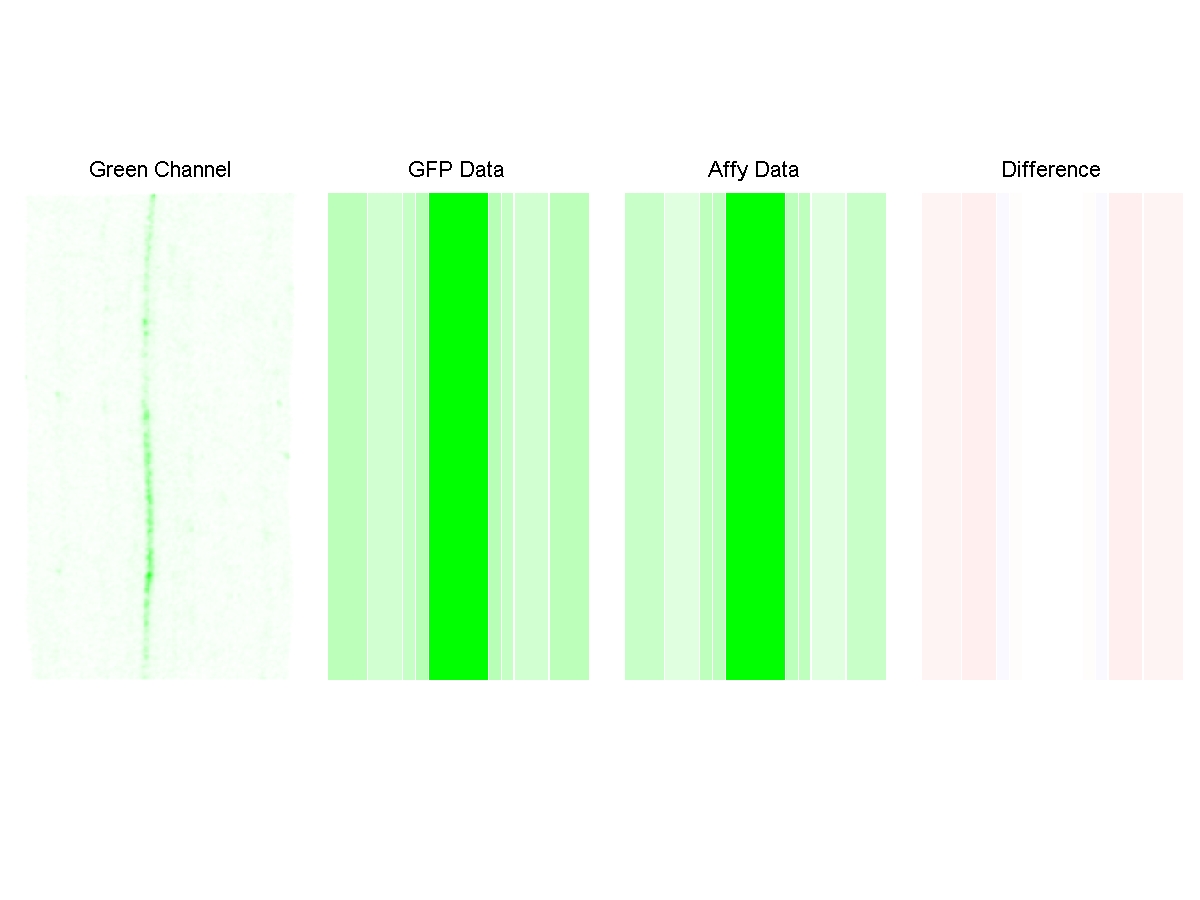
General Information | Image | Atlas Mapped | Tissue | Affy Data | GFP Data | Corelation/TPE Score
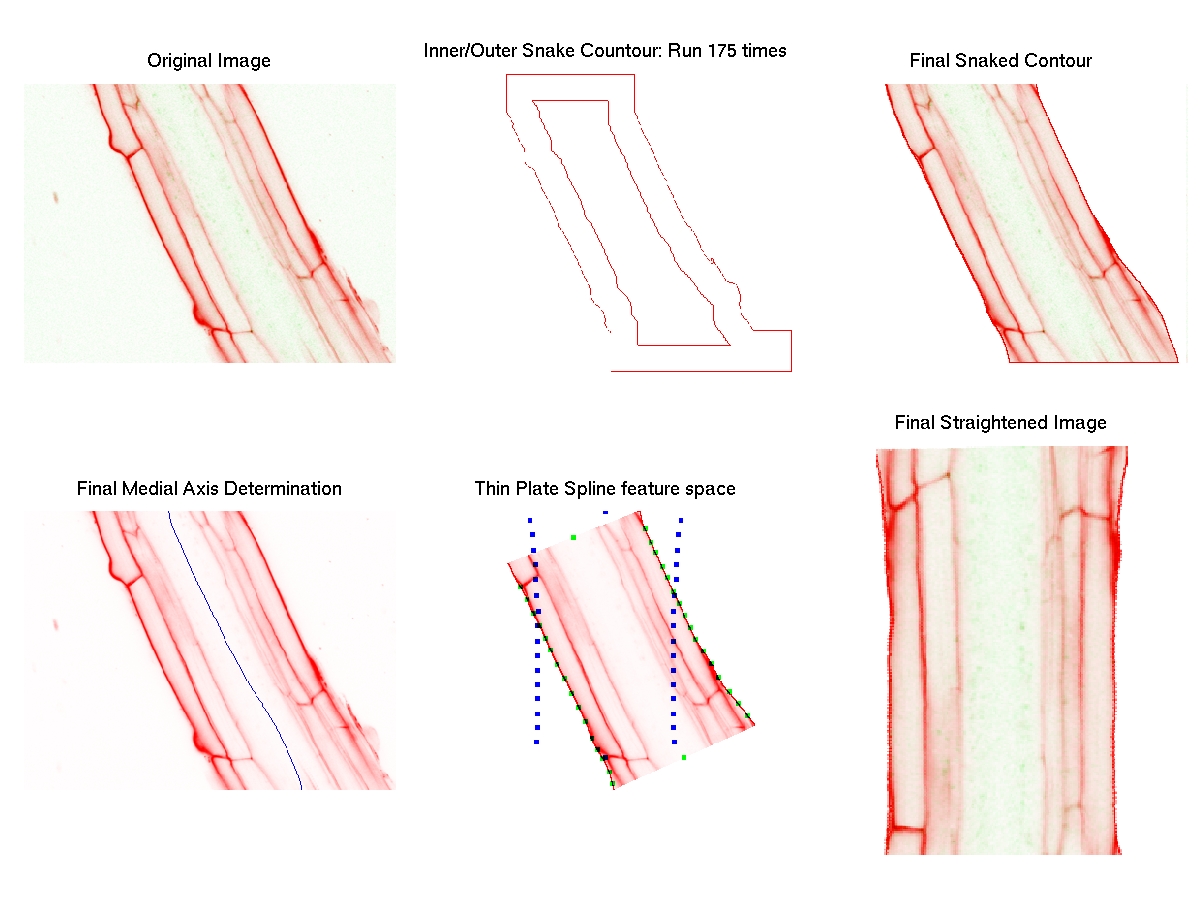
| | Row Number | Diagnostic Image
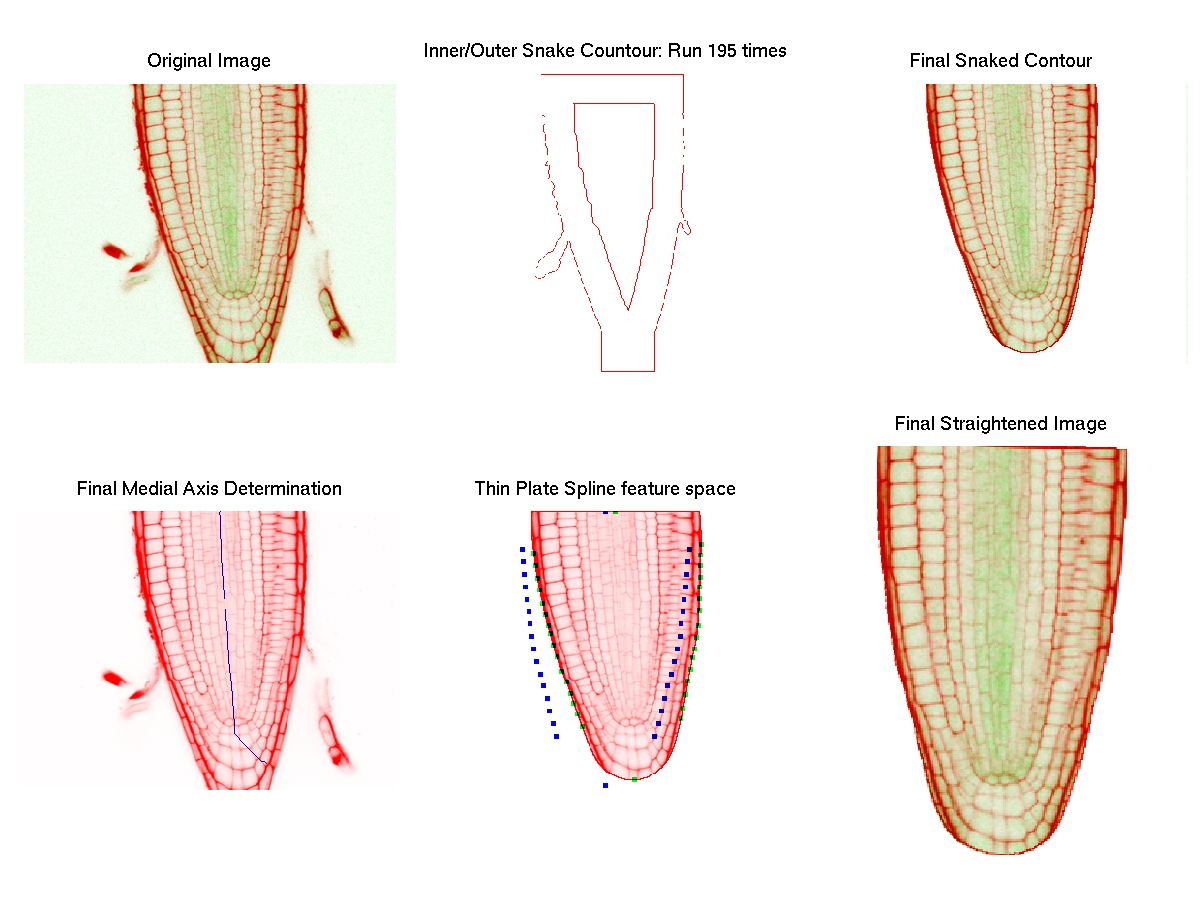
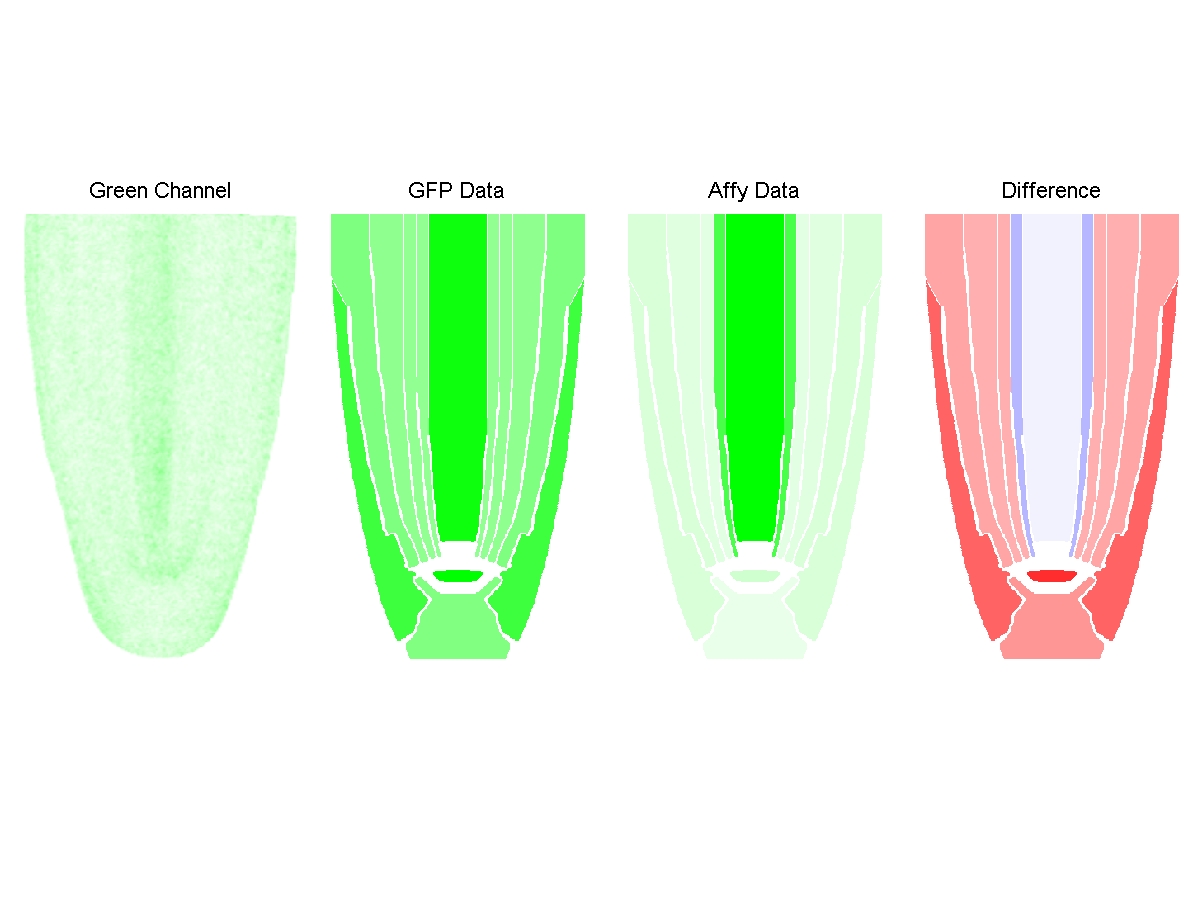
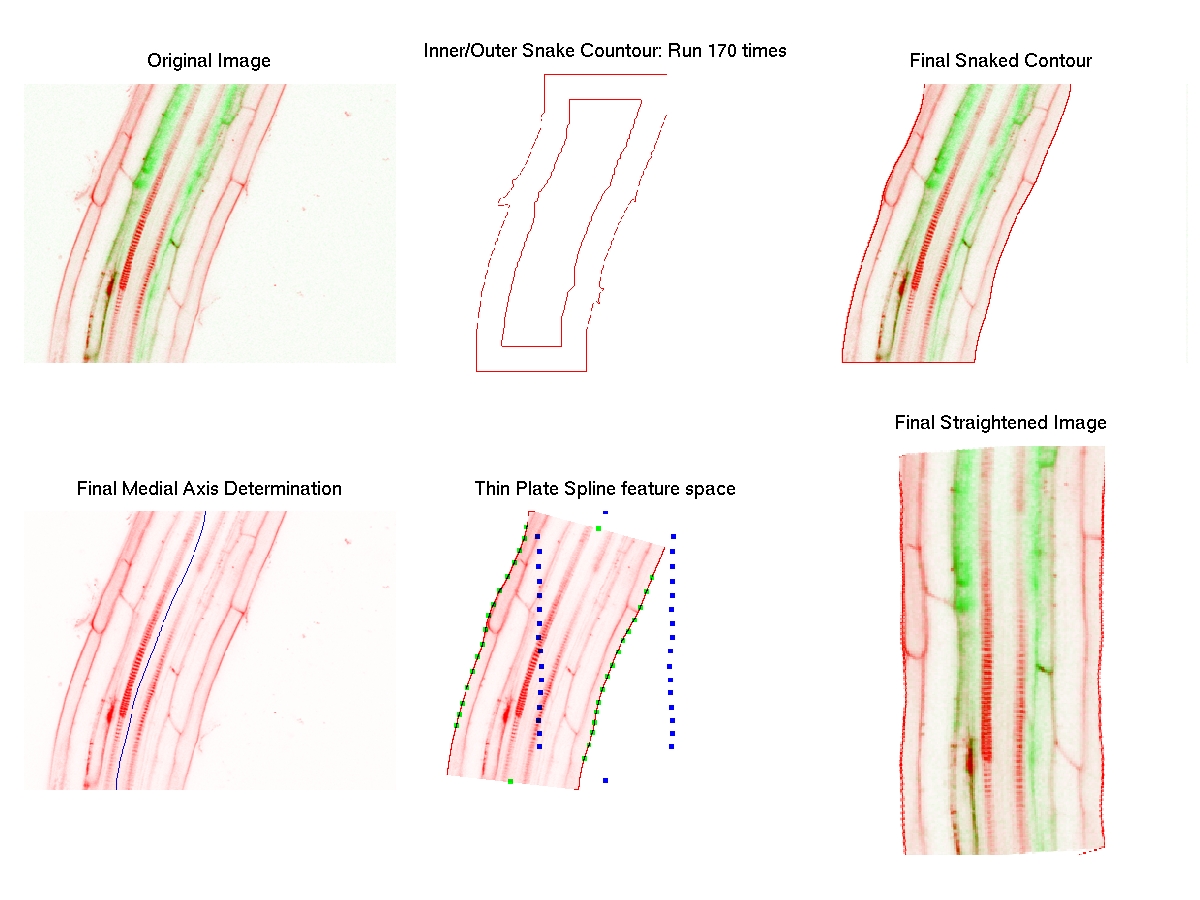
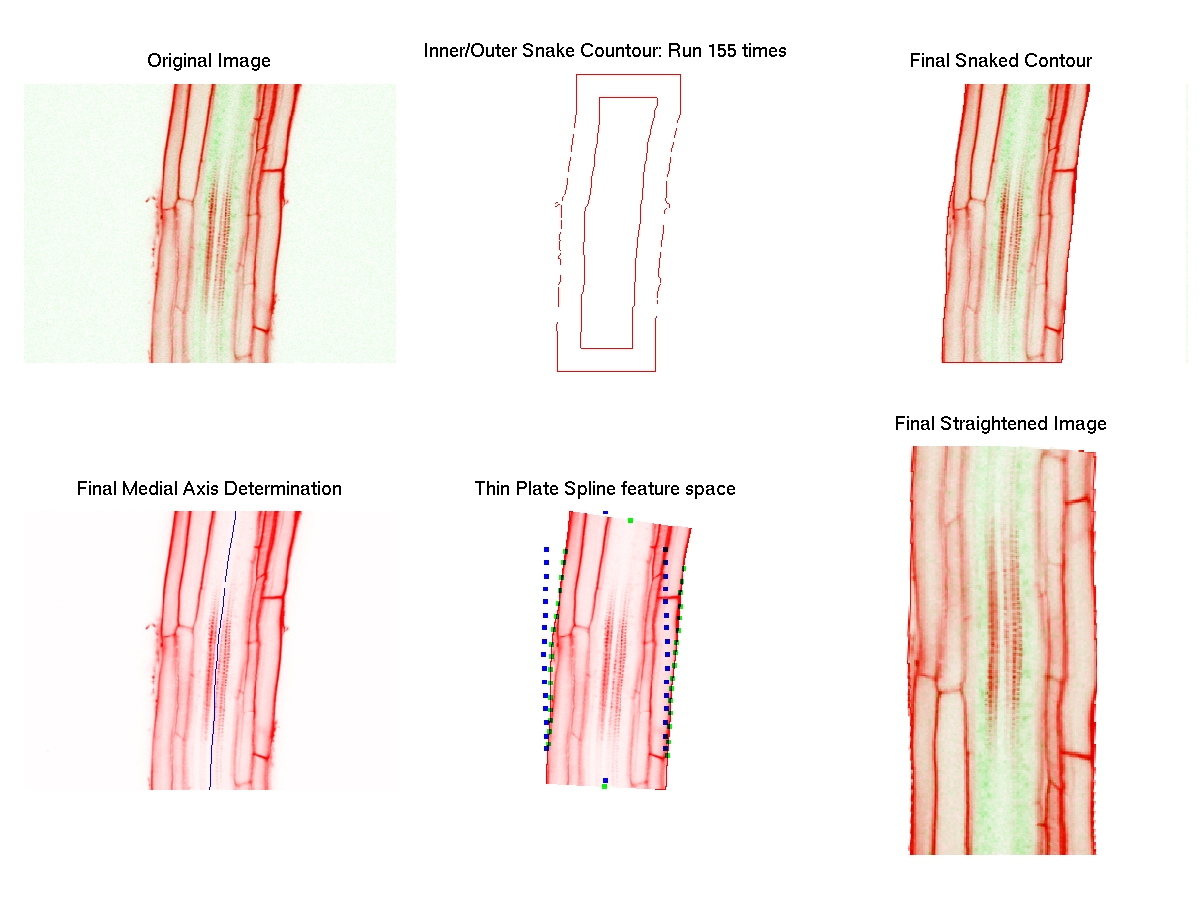
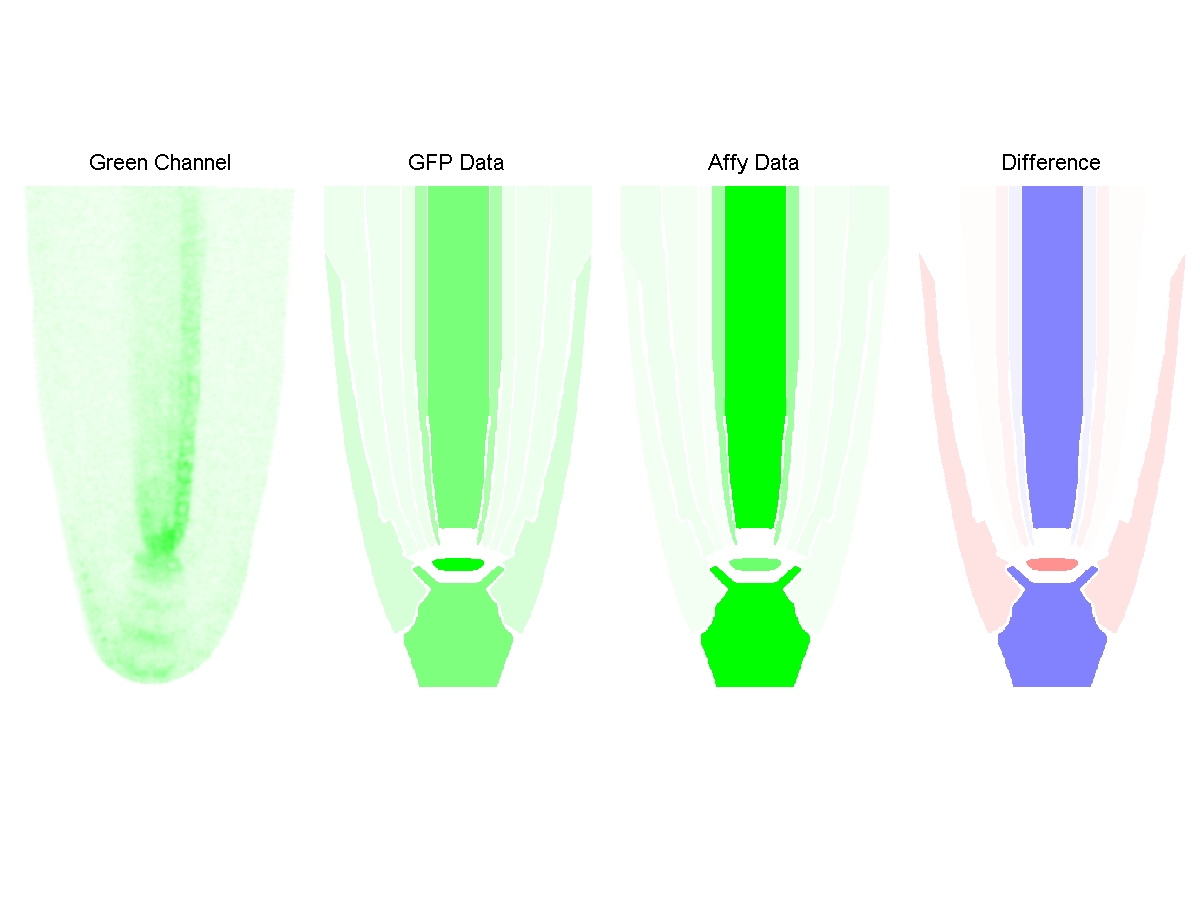
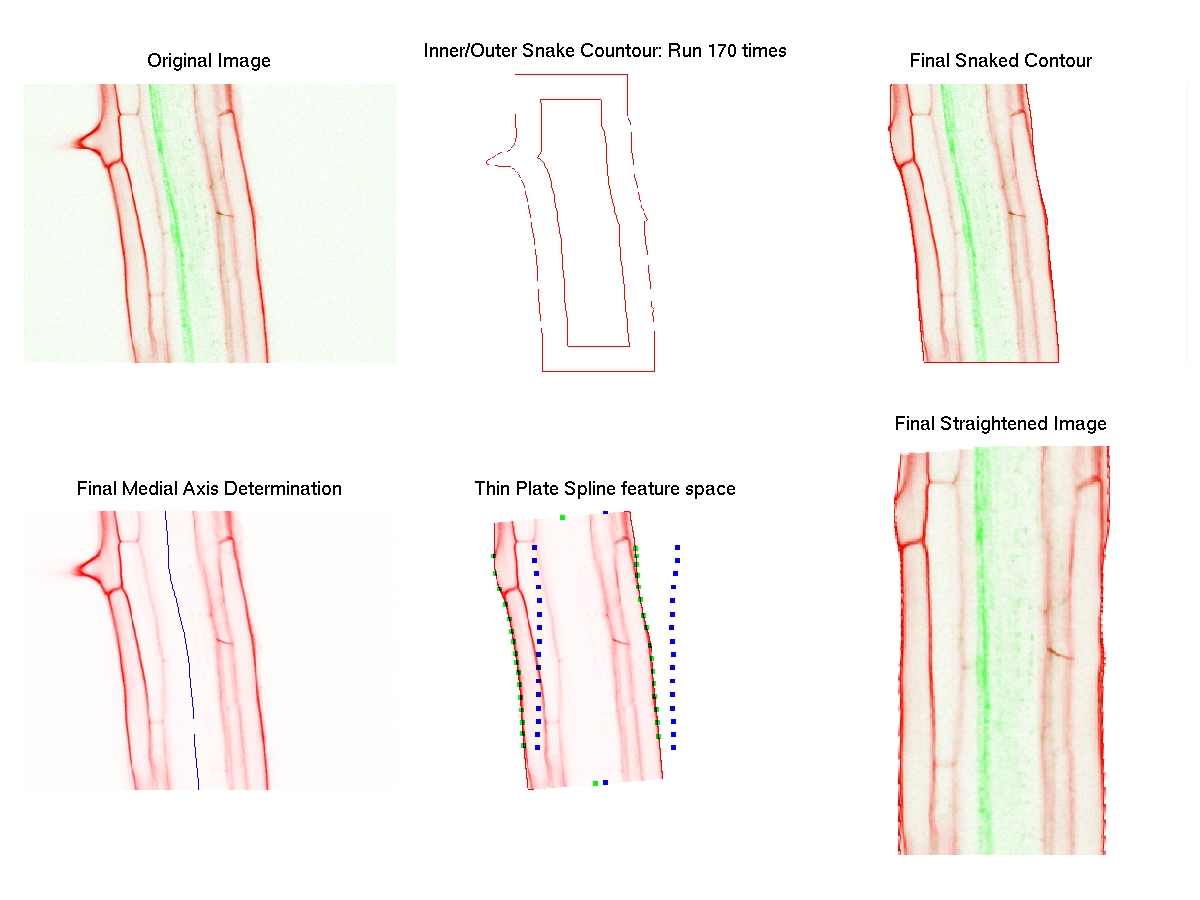
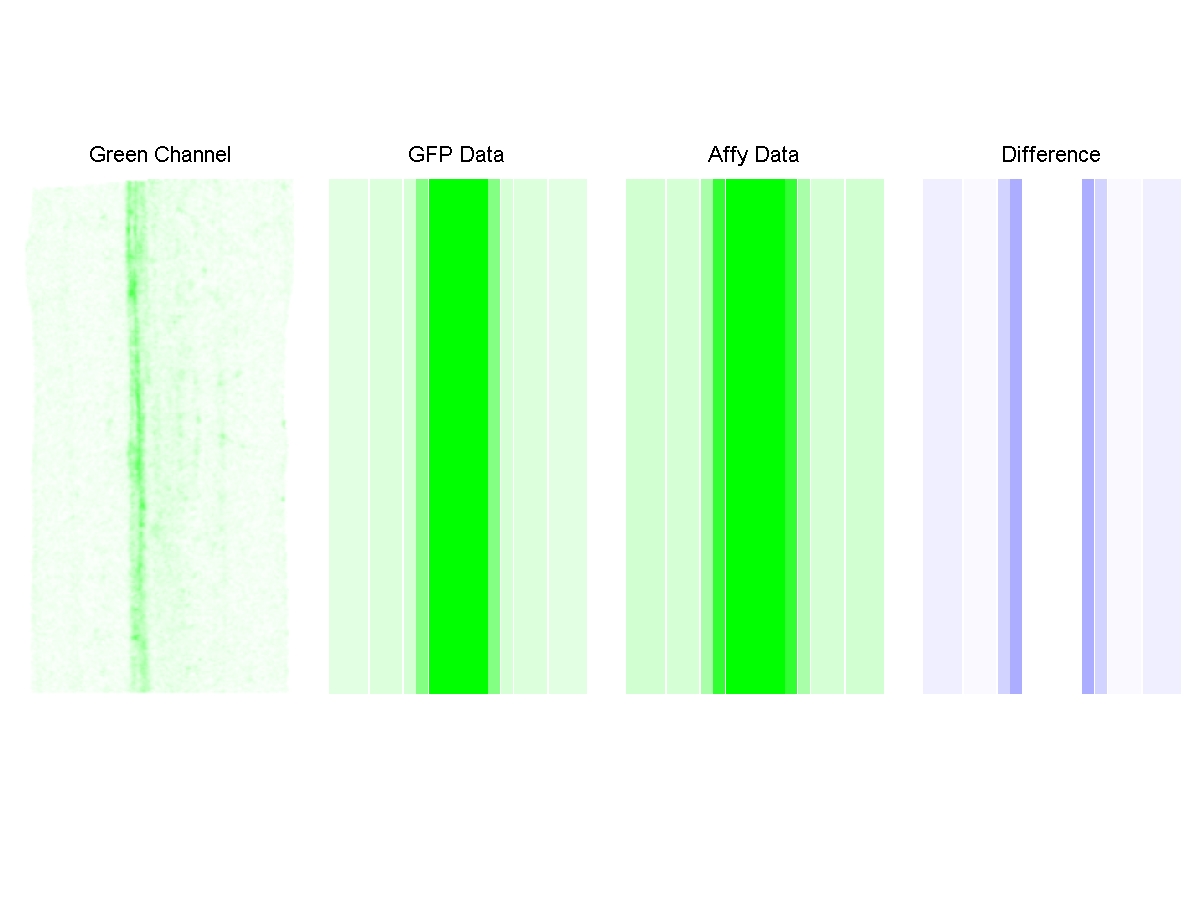
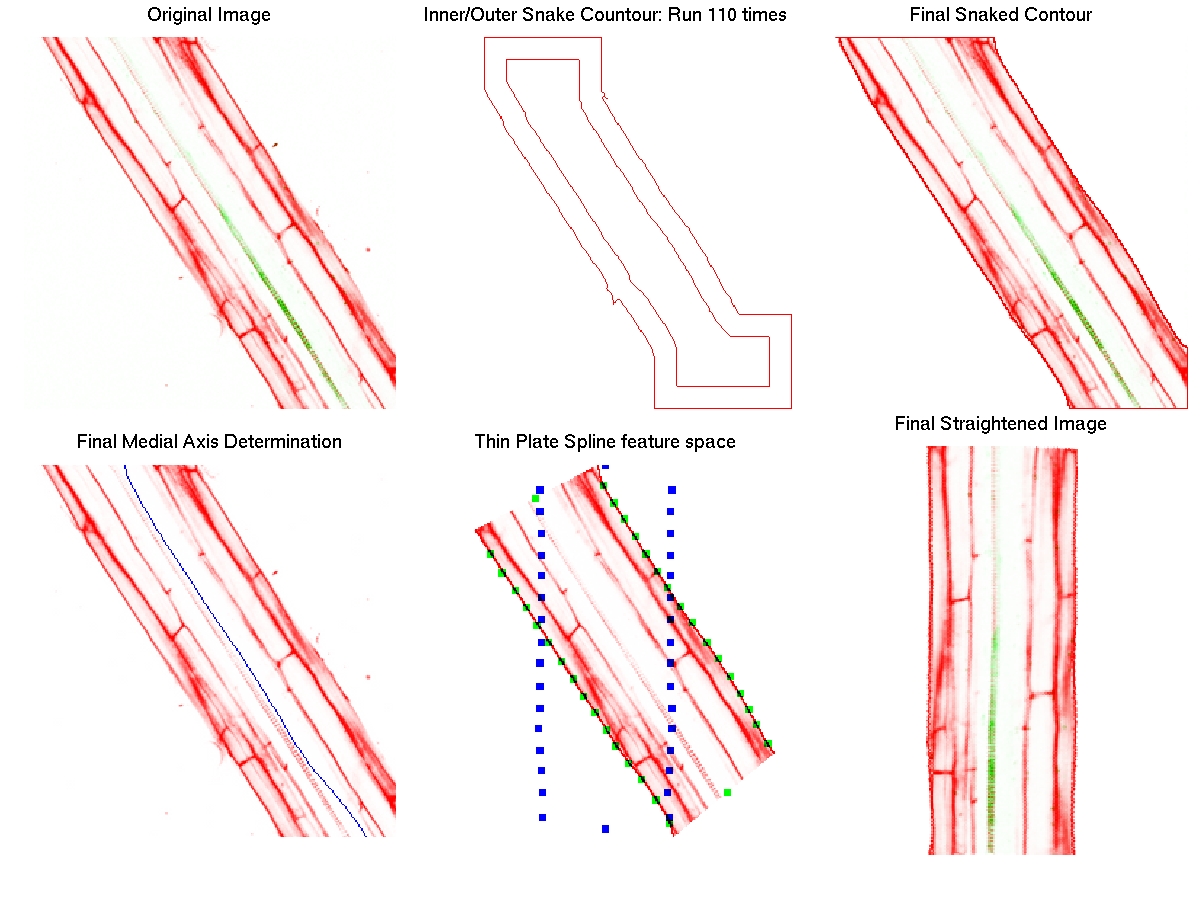
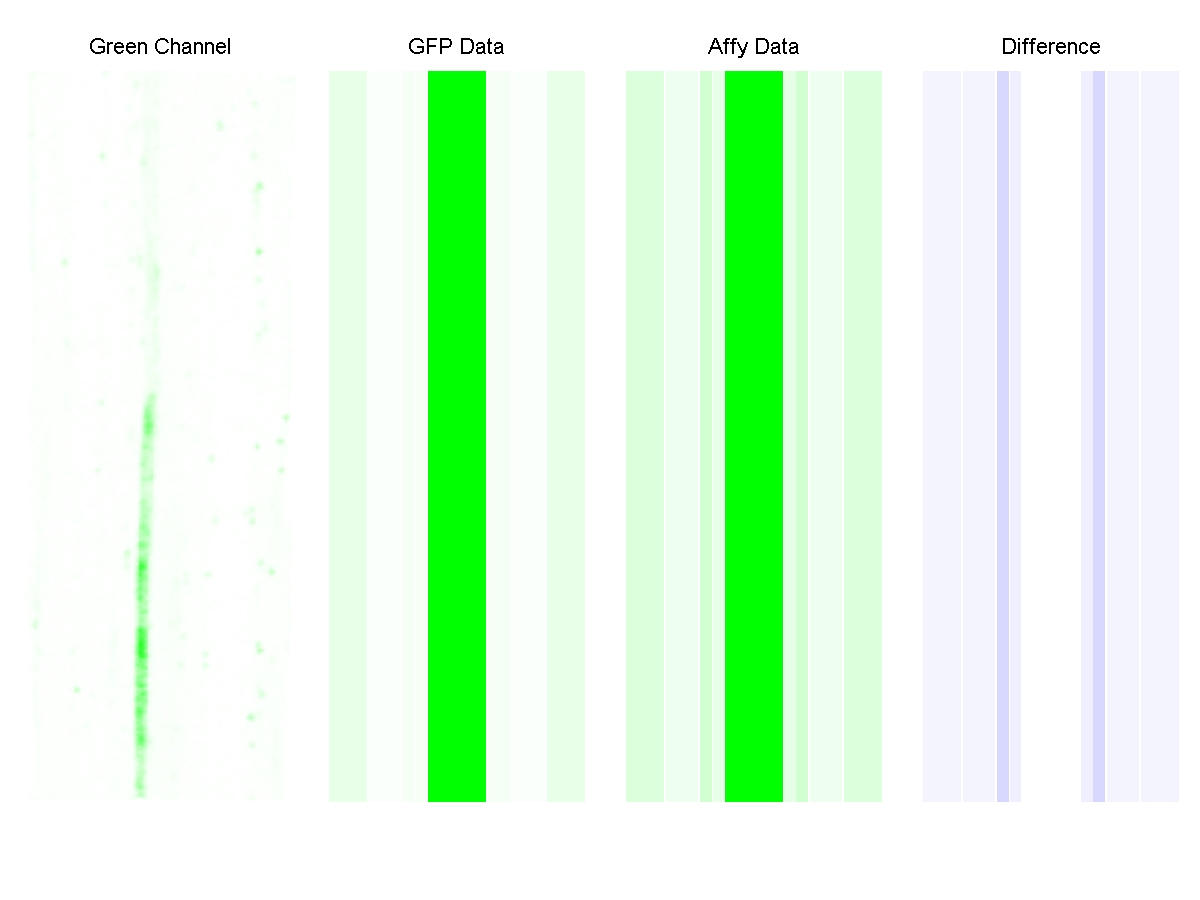
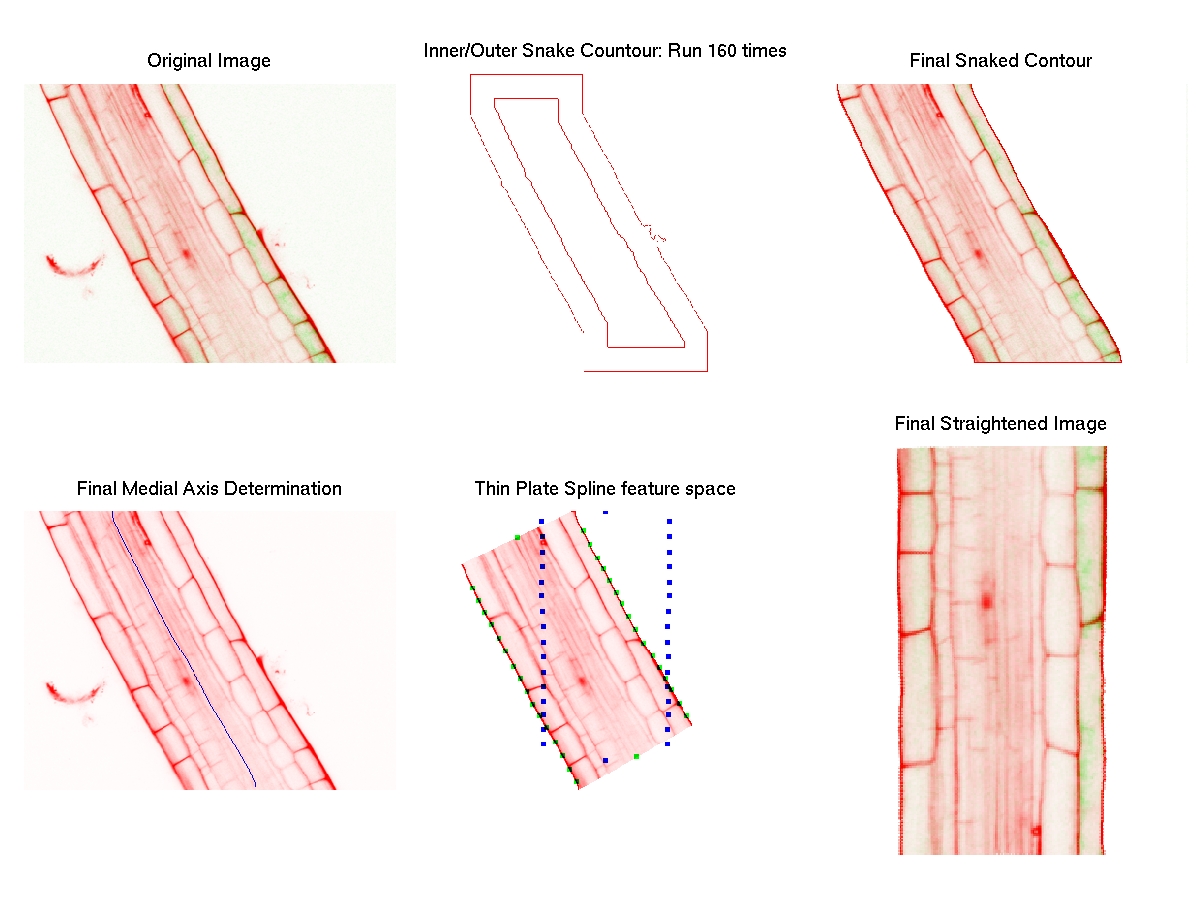
(click to enlarge) |  |  | Columella | NA | NA | Correlation
|
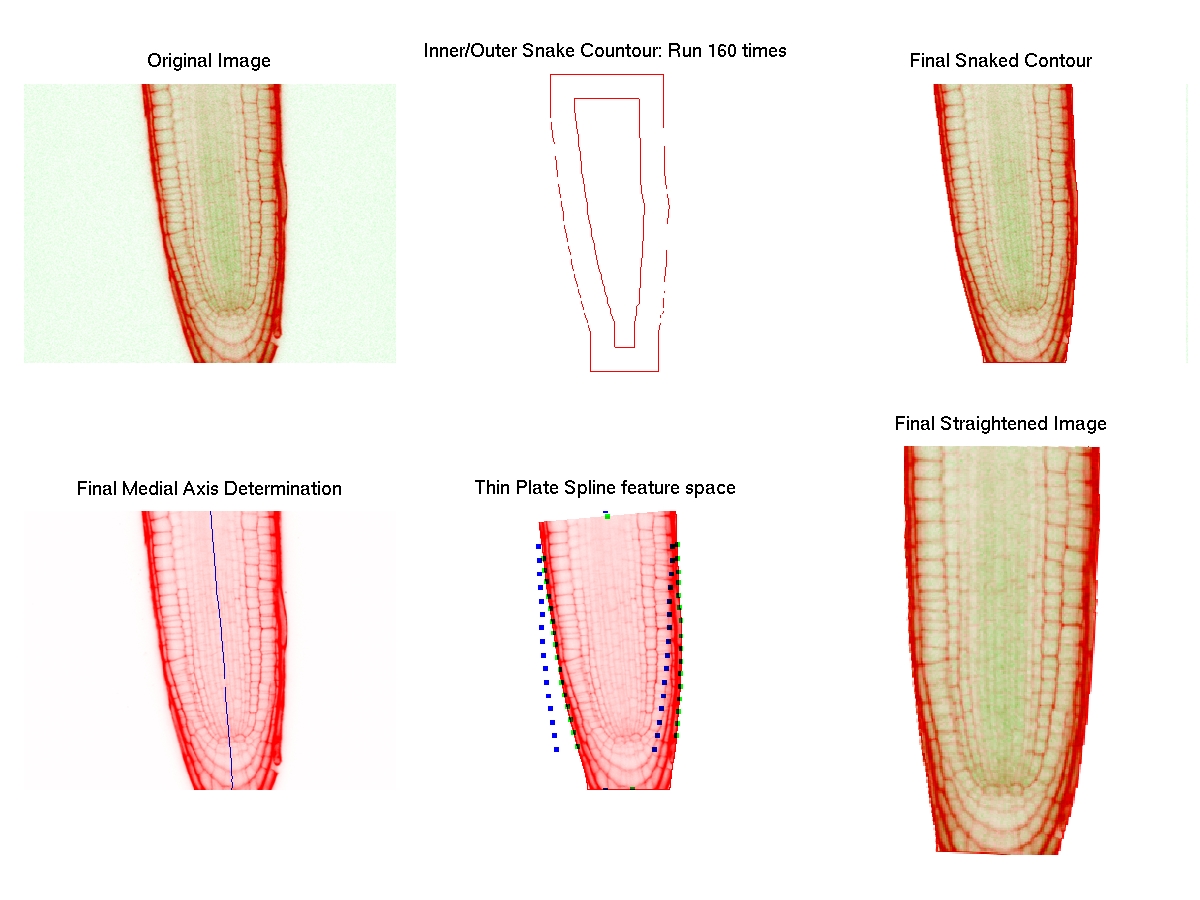
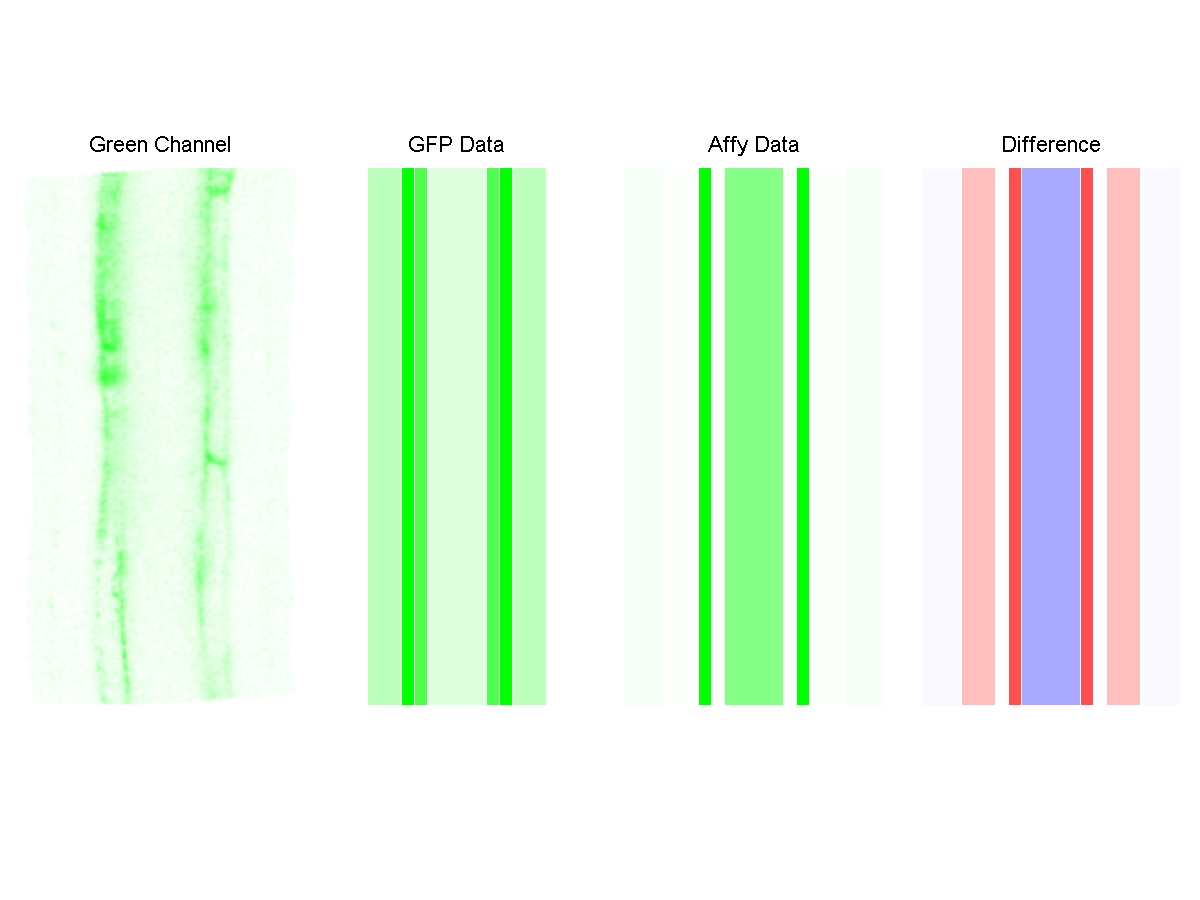
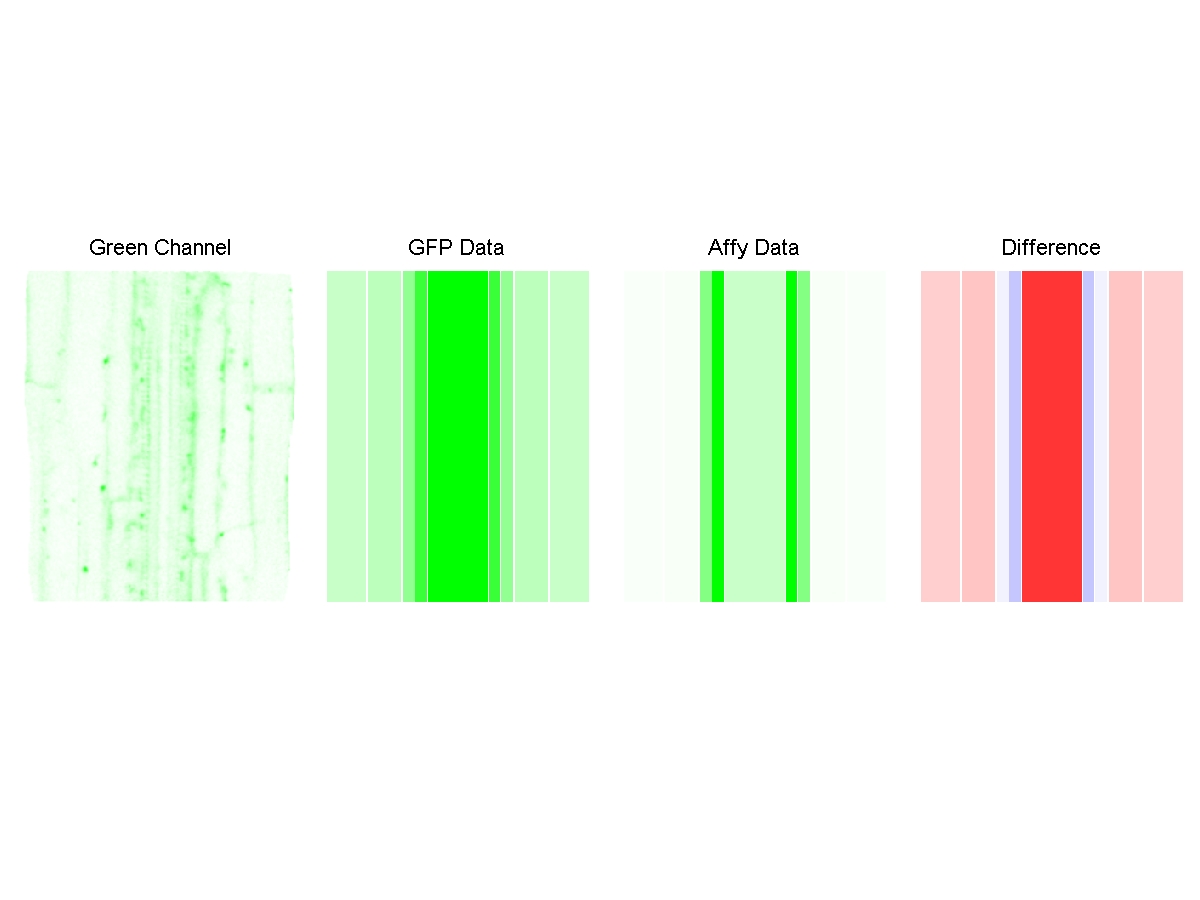
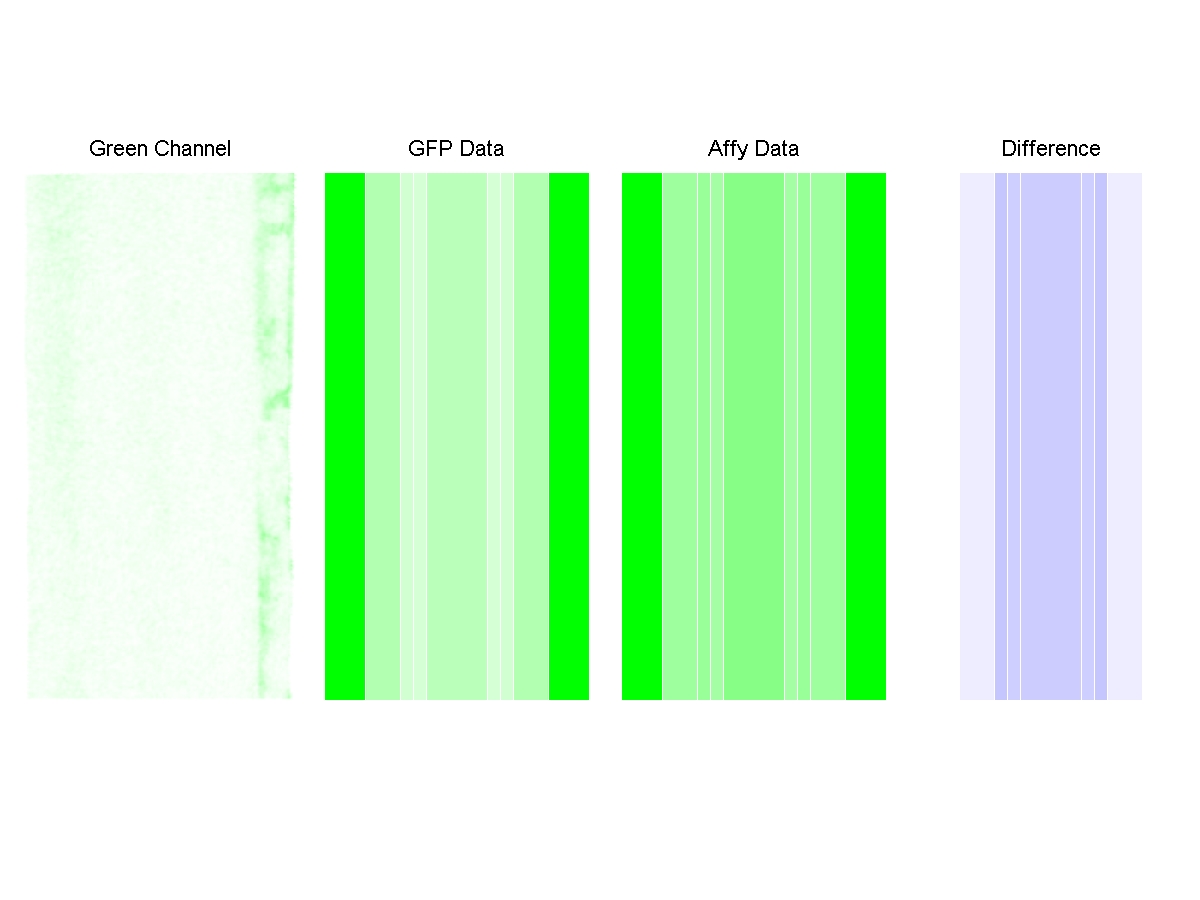
| 2 of 111 |  | Cortex | 181.83 | 0.0743 | -0.354519567957908 |
| AGI Number | Endodermis | 237.27 | 0.0824 |
| AT4G28890 | Epidermis | 30.07 | 0.077 |
| File Name | Difference Image
(click to enlarge) | Lateral Root Cap | NA | NA | TPE Score |
| 328_2_21strainormal |  | Pericycle | 72.13 | 0.1046 | 0.9979083 |
| Line Number | QC | NA | NA |
| 328 | Stele | 82.77 | 0.1338 |
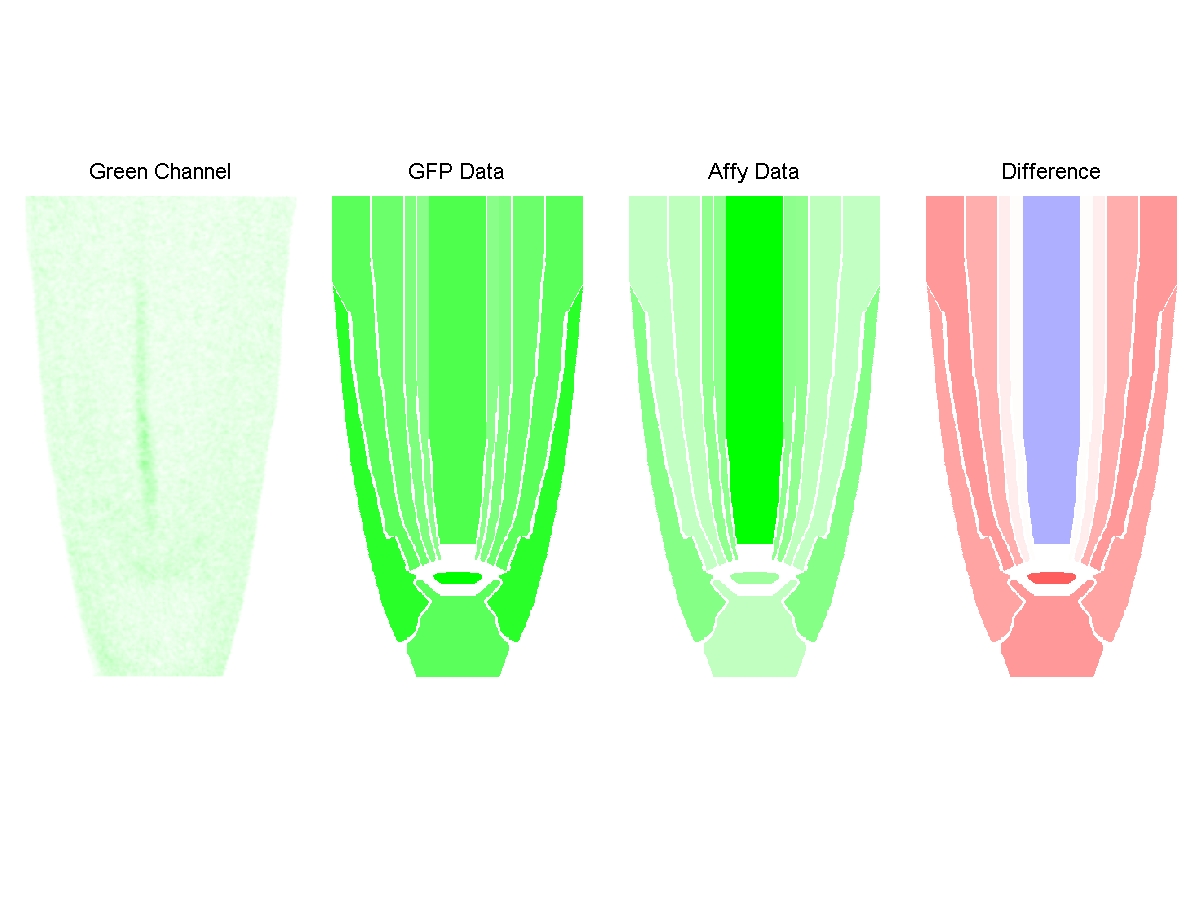
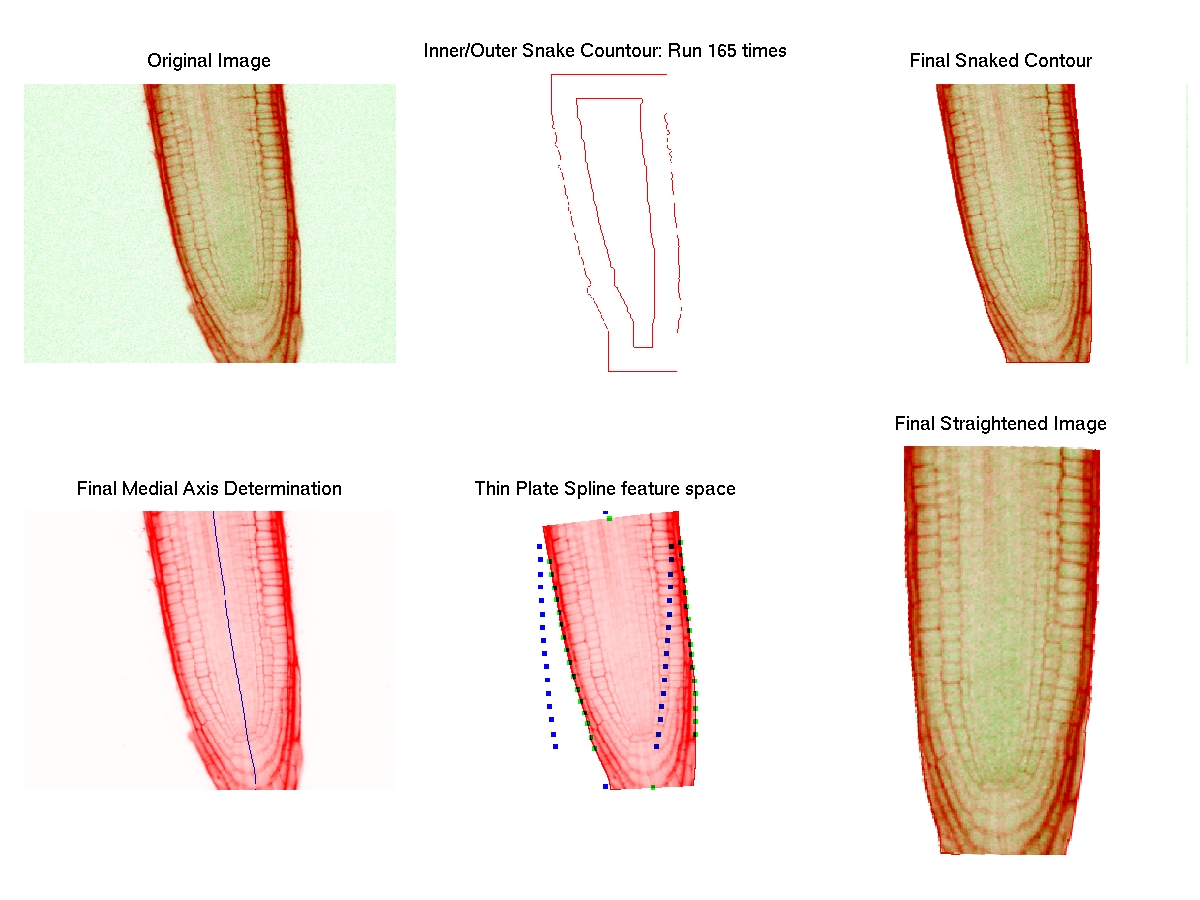
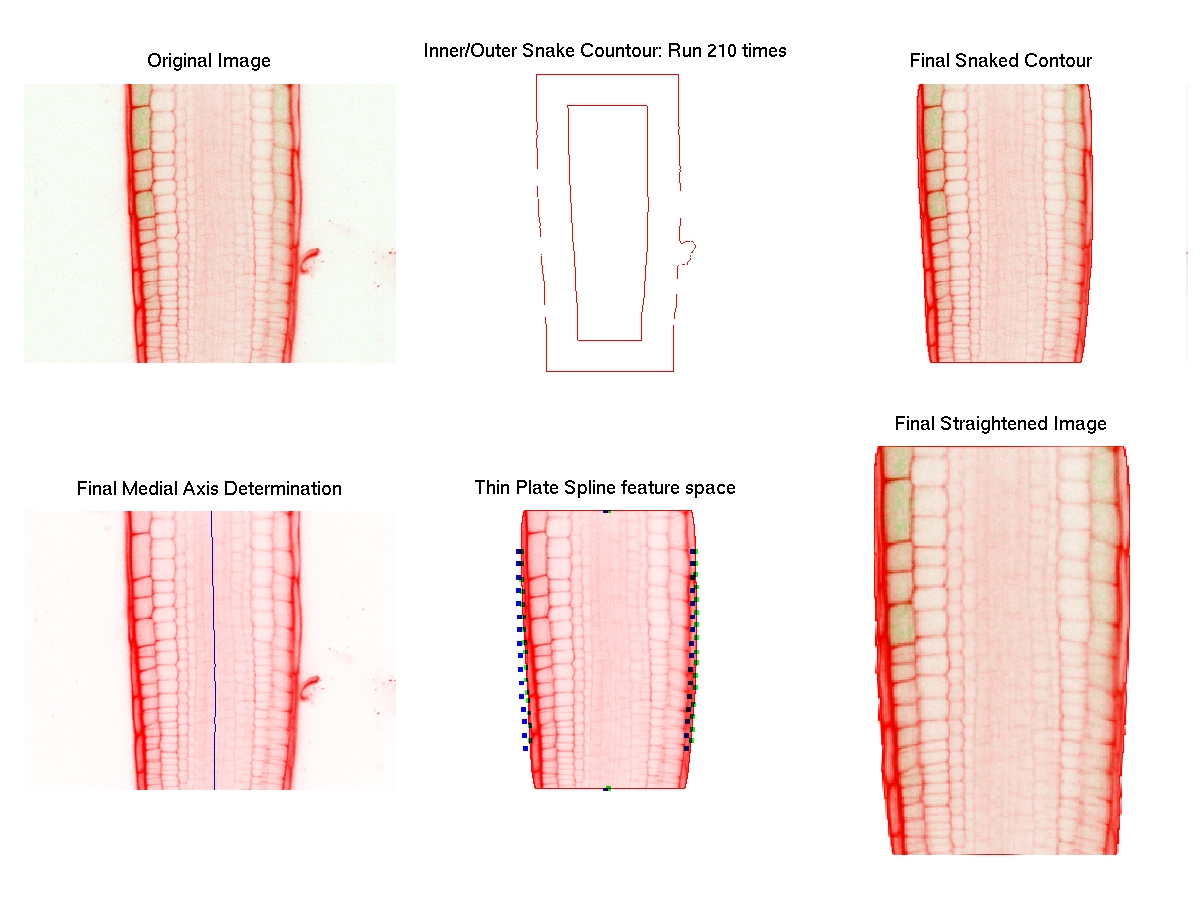
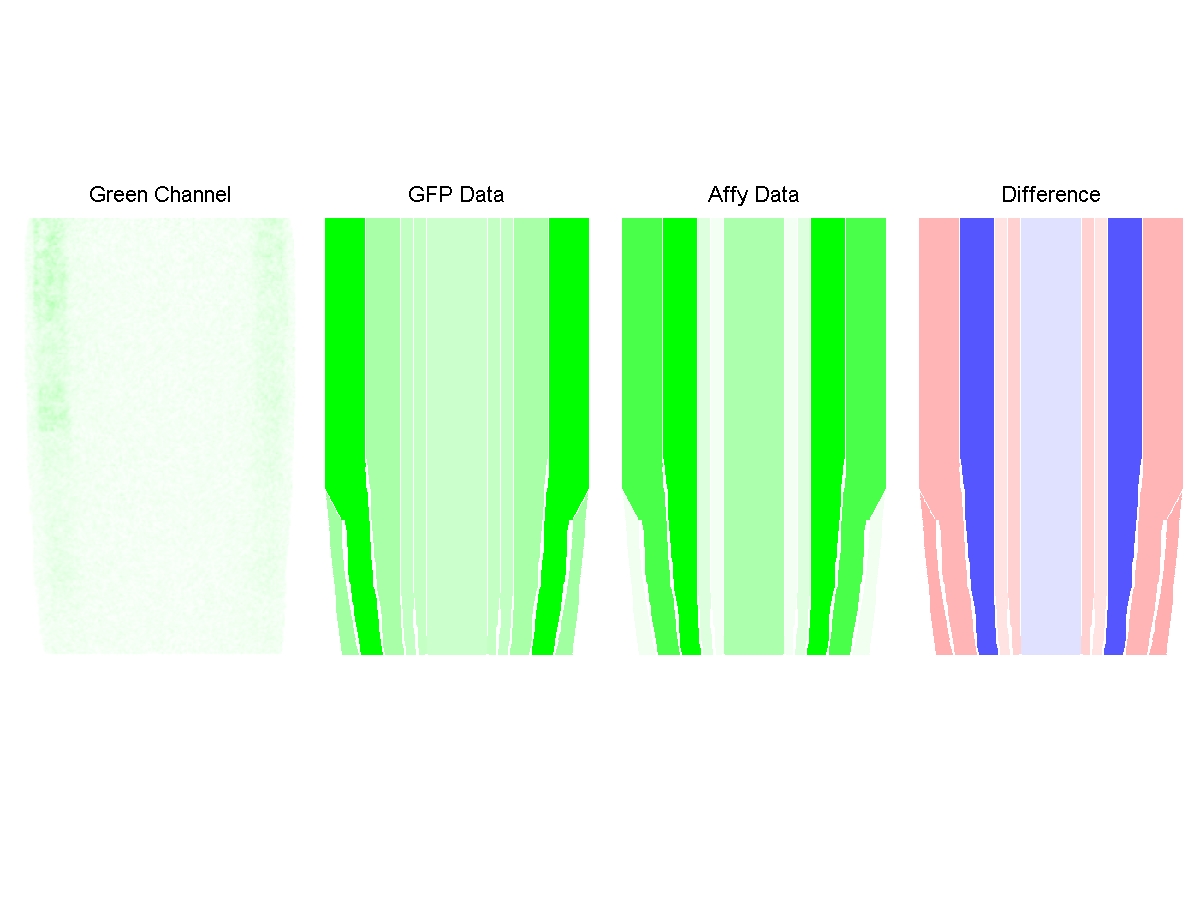
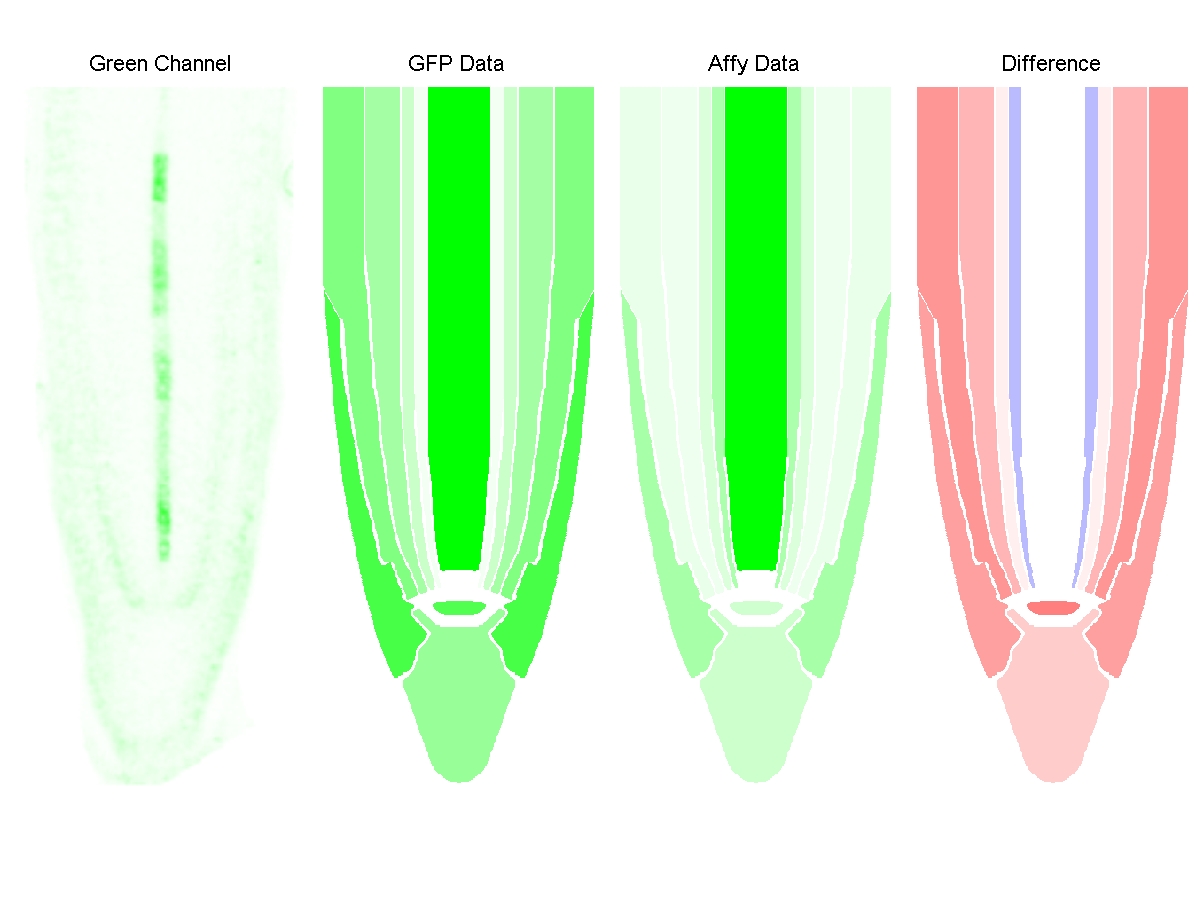
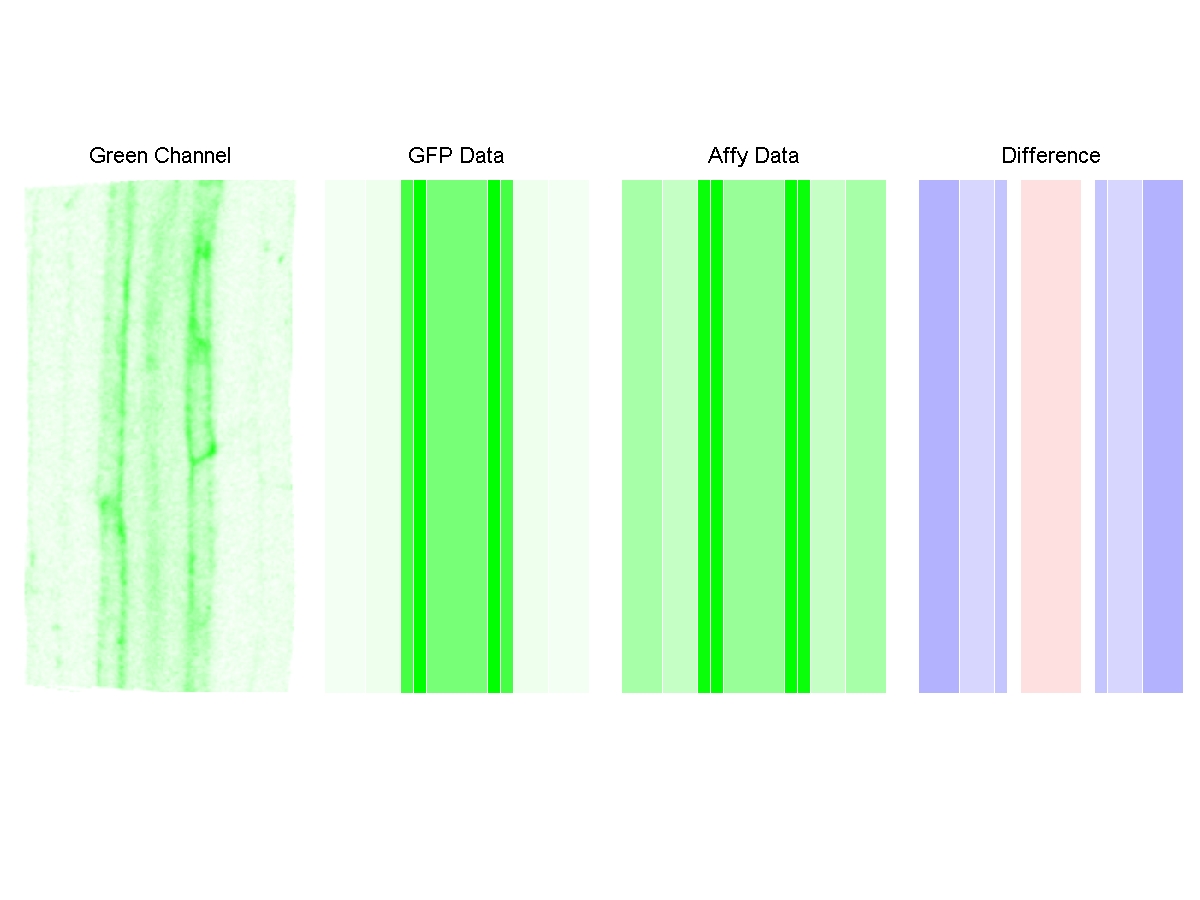
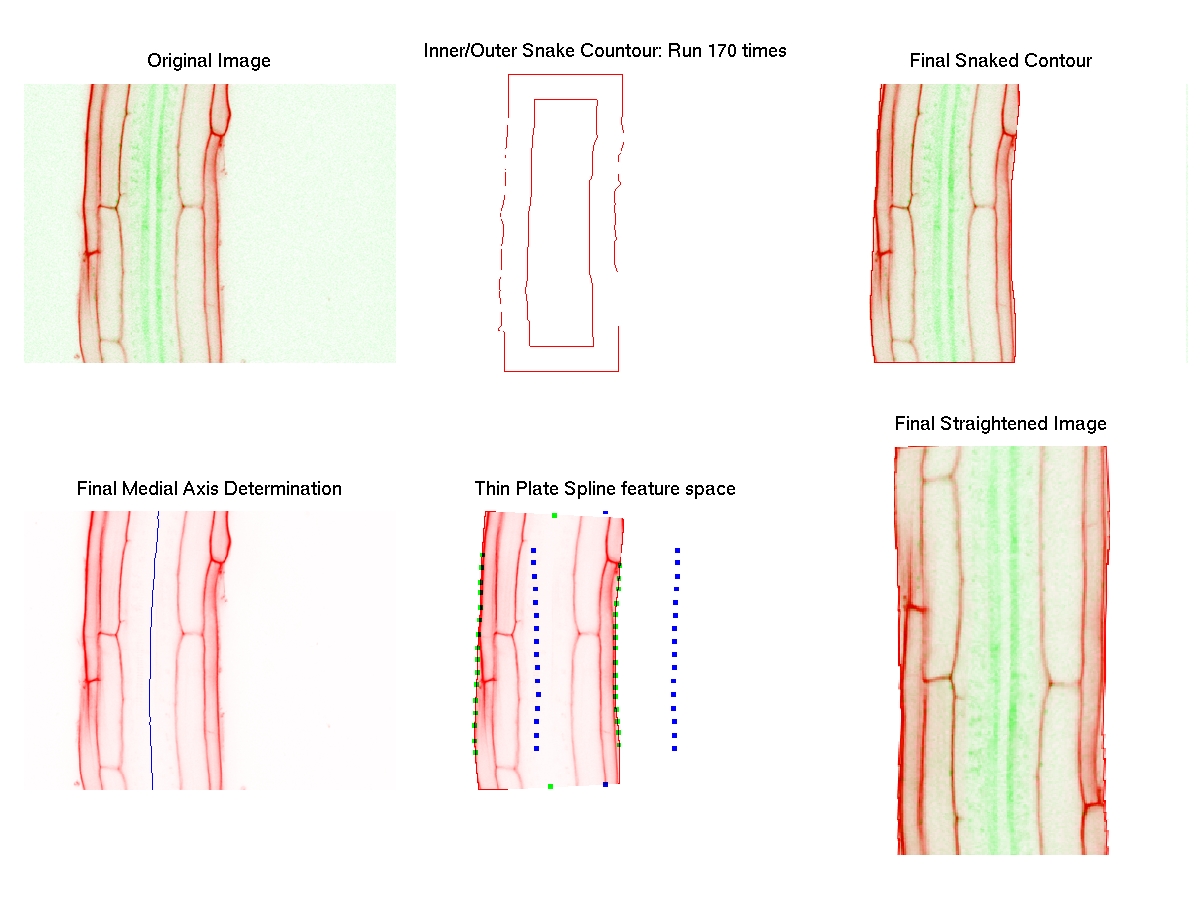
General Information | Image | Atlas Mapped | Tissue | Affy Data | GFP Data | Corelation/TPE Score
| | Row Number | Diagnostic Image
(click to enlarge) |  |  | Columella | 3.47 | 0.0471 | Correlation
|
| 3 of 111 |  | Cortex | 9.83 | 0.015 | 0.0382669311568441 |
| AGI Number | Endodermis | 8.27 | 0.0136 |
| AT3G25710 | Epidermis | 2.5 | 0.0195 |
| File Name | Difference Image
(click to enlarge) | Lateral Root Cap | 1.67 | 0.0298 | TPE Score |
| _783_3_11strainormal |  | Pericycle | 820.57 | 0.0102 | 0.9988786 |
| Line Number | QC | 27.25 | 0.0428 |
| 783 | Stele | 675.57 | 0.0539 |
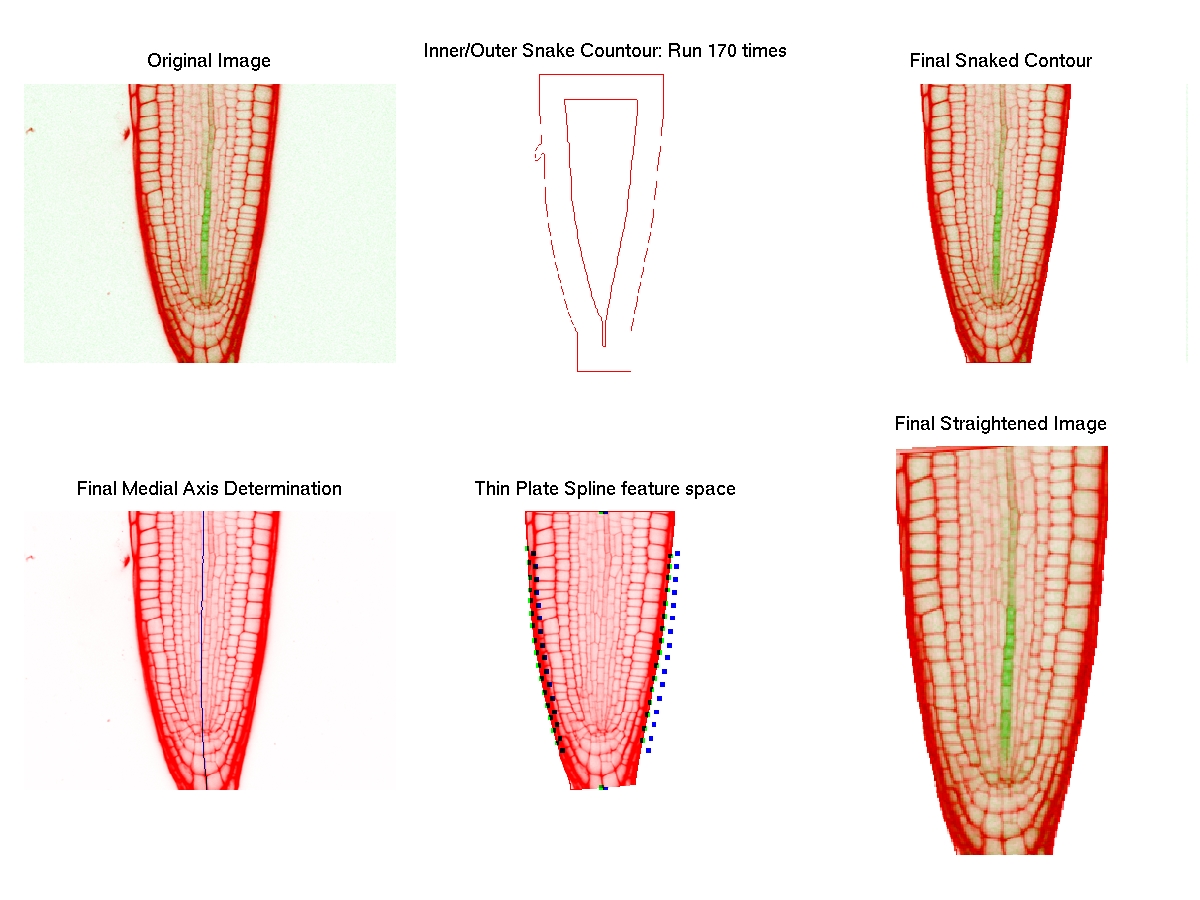
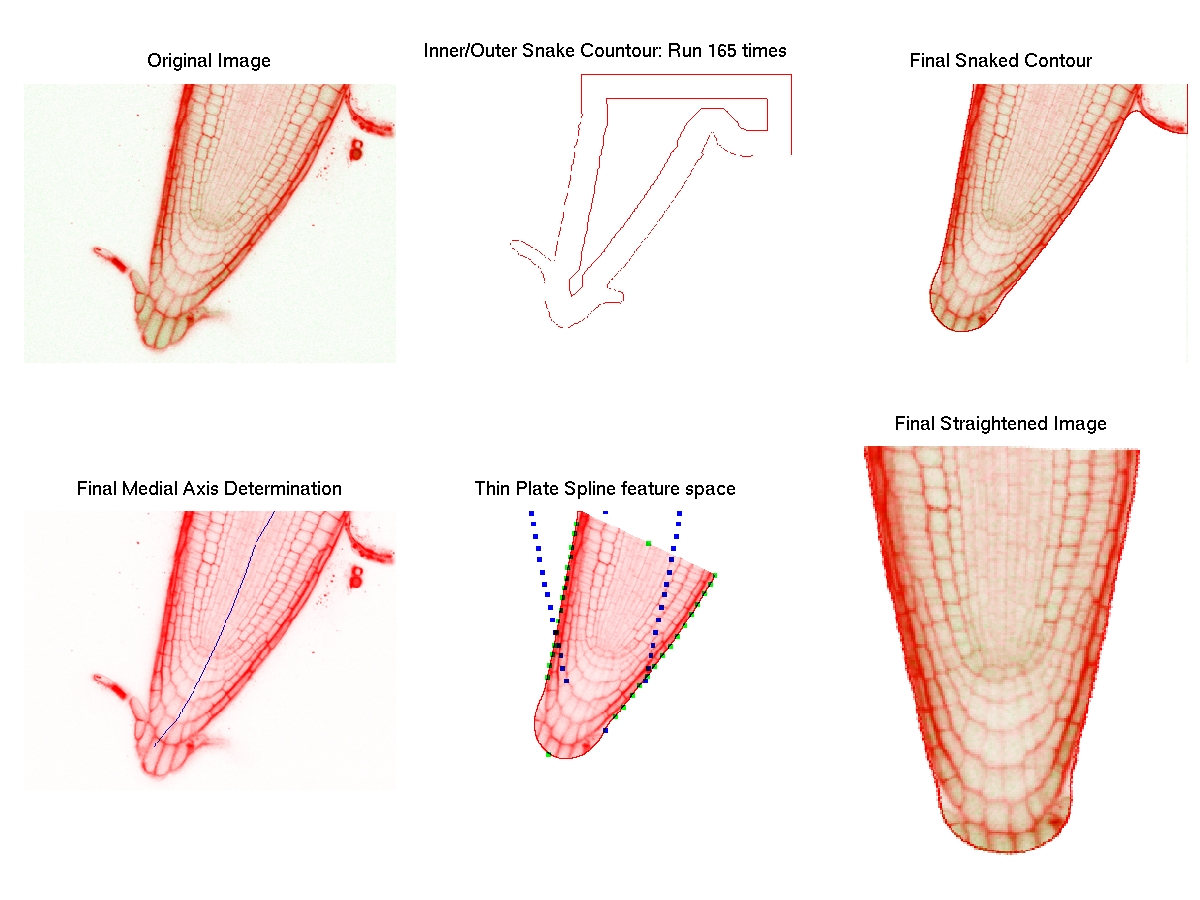
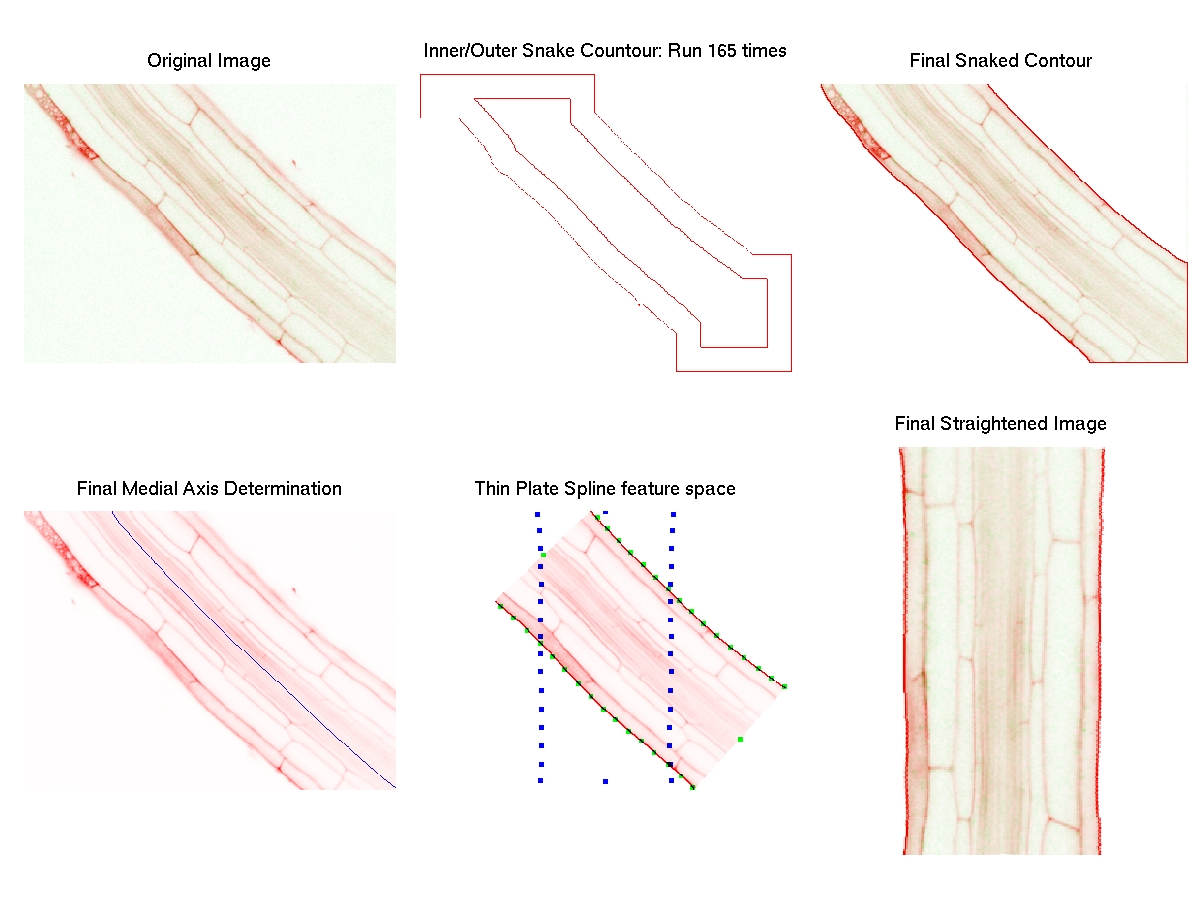
General Information | Image | Atlas Mapped | Tissue | Affy Data | GFP Data | Corelation/TPE Score
| | Row Number | Diagnostic Image
(click to enlarge) |  |  | Columella | 3.47 | 0.0316 | Correlation
|
| 4 of 111 |  | Cortex | 9.83 | 0.0163 | 0.0387342767510915 |
| AGI Number | Endodermis | 8.27 | 0.0131 |
| AT3G25710 | Epidermis | 2.5 | 0.0187 |
| File Name | Difference Image
(click to enlarge) | Lateral Root Cap | 1.67 | 0.037 | TPE Score |
| _783_2_12strainormal |  | Pericycle | 820.57 | 0.0127 | 0.8674462 |
| Line Number | QC | 27.25 | 0.0536 |
| 783 | Stele | 675.57 | 0.0511 |
General Information | Image | Atlas Mapped | Tissue | Affy Data | GFP Data | Corelation/TPE Score
| | Row Number | Diagnostic Image
(click to enlarge) |  |  | Columella | 3.47 | 0.0312 | Correlation
|
| 5 of 111 |  | Cortex | 9.83 | 0.0256 | 0.728227553276929 |
| AGI Number | Endodermis | 8.27 | 0.0222 |
| AT3G25710 | Epidermis | 2.5 | 0.0244 |
| File Name | Difference Image
(click to enlarge) | Lateral Root Cap | 1.67 | 0.0371 | TPE Score |
| 783.3.2.1strainormal |  | Pericycle | 820.57 | 0.0546 | 0.810437 |
| Line Number | QC | 27.25 | 0.0425 |
| 783 | Stele | 675.57 | 0.1362 |
General Information | Image | Atlas Mapped | Tissue | Affy Data | GFP Data | Corelation/TPE Score
| | Row Number | Diagnostic Image
(click to enlarge) |  |  | Columella | 43.37 | 0.0568 | Correlation
|
| 6 of 111 |  | Cortex | 45.2 | 0.0907 | -0.391700470342377 |
| AGI Number | Endodermis | 77.1 | 0.0832 |
| AT2G37590 | Epidermis | 42.67 | 0.1018 |
| File Name | Difference Image
(click to enlarge) | Lateral Root Cap | 84.53 | 0.1088 | TPE Score |
| 424-2-1strainormal |  | Pericycle | 79.57 | 0.0679 | 0.8828504 |
| Line Number | QC | 66.8 | 0.12 |
| 424 | Stele | 178.7 | 0.0567 |
General Information | Image | Atlas Mapped | Tissue | Affy Data | GFP Data | Corelation/TPE Score
| | Row Number | Diagnostic Image
(click to enlarge) |  |  | Columella | 43.37 | 0.0881 | Correlation
|
| 7 of 111 |  | Cortex | 45.2 | 0.06 | -0.0933613932175706 |
| AGI Number | Endodermis | 77.1 | 0.0488 |
| AT2G37590 | Epidermis | 42.67 | 0.0777 |
| File Name | Difference Image
(click to enlarge) | Lateral Root Cap | 84.53 | 0.1004 | TPE Score |
| 426-2-4strainormal |  | Pericycle | 79.57 | 0.0418 | 0.99467 |
| Line Number | QC | 66.8 | 0.0878 |
| 426 | Stele | 178.7 | 0.0699 |
General Information | Image | Atlas Mapped | Tissue | Affy Data | GFP Data | Corelation/TPE Score
| | Row Number | Diagnostic Image
(click to enlarge) |  |  | Columella | 43.37 | 0.0548 | Correlation
|
| 8 of 111 |  | Cortex | 45.2 | 0.0493 | 0.0811512201053981 |
| AGI Number | Endodermis | 77.1 | 0.0434 |
| AT2G37590 | Epidermis | 42.67 | 0.0553 |
| File Name | Difference Image
(click to enlarge) | Lateral Root Cap | 84.53 | 0.0717 | TPE Score |
| 426-2-1strainormal |  | Pericycle | 79.57 | 0.0395 | 0.9803737 |
| Line Number | QC | 66.8 | 0.0857 |
| 426 | Stele | 178.7 | 0.0593 |
General Information | Image | Atlas Mapped | Tissue | Affy Data | GFP Data | Corelation/TPE Score
| | Row Number | Diagnostic Image
(click to enlarge) |  |  | Columella | 43.37 | 0.0878 | Correlation
|
| 9 of 111 |  | Cortex | 45.2 | 0.0473 | 0.276667414405745 |
| AGI Number | Endodermis | 77.1 | 0.0429 |
| AT2G37590 | Epidermis | 42.67 | 0.0622 |
| File Name | Difference Image
(click to enlarge) | Lateral Root Cap | 84.53 | 0.1049 | TPE Score |
| 426-2-2strainormal |  | Pericycle | 79.57 | 0.0352 | 0.972573 |
| Line Number | QC | 66.8 | 0.1206 |
| 426 | Stele | 178.7 | 0.0967 |
General Information | Image | Atlas Mapped | Tissue | Affy Data | GFP Data | Corelation/TPE Score
| | Row Number | Diagnostic Image
(click to enlarge) |  |  | Columella | NA | NA | Correlation
|
| 10 of 111 |  | Cortex | 45.2 | 0.0442 | 0.401622745426593 |
| AGI Number | Endodermis | 77.1 | 0.0379 |
| AT2G37590 | Epidermis | 42.67 | 0.0659 |
| File Name | Difference Image
(click to enlarge) | Lateral Root Cap | NA | NA | TPE Score |
| 426-2-3strainormal |  | Pericycle | 79.57 | 0.0371 | 0.9727796 |
| Line Number | QC | NA | NA |
| 426 | Stele | 178.7 | 0.0671 |
General Information | Image | Atlas Mapped | Tissue | Affy Data | GFP Data | Corelation/TPE Score
| | Row Number | Diagnostic Image
(click to enlarge) |  |  | Columella | 37.5 | 0.109 | Correlation
|
| 11 of 111 | 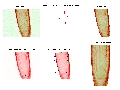 | Cortex | 52.83 | 0.1275 | -0.406577814835073 |
| AGI Number | Endodermis | 48.1 | 0.1129 |
| AT1G52150 | Epidermis | 64.1 | 0.1429 |
| File Name | Difference Image
(click to enlarge) | Lateral Root Cap | 65.43 | 0.1558 | TPE Score |
| 470-3-1strainormal |  | Pericycle | 312.73 | 0.0974 | 0.8140813 |
| Line Number | QC | 81.65 | 0.1387 |
| 470 | Stele | 440.6 | 0.1192 |
General Information | Image | Atlas Mapped | Tissue | Affy Data | GFP Data | Corelation/TPE Score
| | Row Number | Diagnostic Image
(click to enlarge) |  |  | Columella | 37.5 | 0.0852 | Correlation
|
| 12 of 111 | 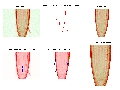 | Cortex | 52.83 | 0.0868 | -0.329854986592341 |
| AGI Number | Endodermis | 48.1 | 0.0787 |
| AT1G52150 | Epidermis | 64.1 | 0.111 |
| File Name | Difference Image
(click to enlarge) | Lateral Root Cap | 65.43 | 0.1174 | TPE Score |
| 470-3-3strainormal | 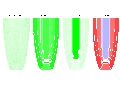 | Pericycle | 312.73 | 0.0683 | 0.9947293 |
| Line Number | QC | 81.65 | 0.1275 |
| 470 | Stele | 440.6 | 0.0915 |
General Information | Image | Atlas Mapped | Tissue | Affy Data | GFP Data | Corelation/TPE Score
| | Row Number | Diagnostic Image
(click to enlarge) | 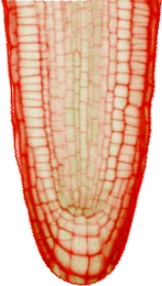 | 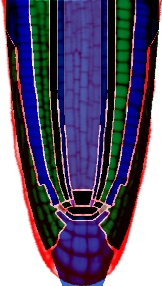 | Columella | 37.5 | 0.1084 | Correlation
|
| 13 of 111 |  | Cortex | 52.83 | 0.0537 | -0.236450501467231 |
| AGI Number | Endodermis | 48.1 | 0.054 |
| AT1G52150 | Epidermis | 64.1 | 0.0618 |
| File Name | Difference Image
(click to enlarge) | Lateral Root Cap | 65.43 | 0.1074 | TPE Score |
| 471-1-5strainormal |  | Pericycle | 312.73 | 0.0429 | 0.9573739 |
| Line Number | QC | 81.65 | 0.1466 |
| 471 | Stele | 440.6 | 0.0804 |
General Information | Image | Atlas Mapped | Tissue | Affy Data | GFP Data | Corelation/TPE Score
| | Row Number | Diagnostic Image
(click to enlarge) |  |  | Columella | 37.5 | 0.0735 | Correlation
|
| 14 of 111 |  | Cortex | 52.83 | 0.0648 | 0.343491364253211 |
| AGI Number | Endodermis | 48.1 | 0.0631 |
| AT1G52150 | Epidermis | 64.1 | 0.0745 |
| File Name | Difference Image
(click to enlarge) | Lateral Root Cap | 65.43 | 0.1128 | TPE Score |
| 471-1-1strainormal |  | Pericycle | 312.73 | 0.064 | 0.9249989 |
| Line Number | QC | 81.65 | 0.1484 |
| 471 | Stele | 440.6 | 0.1401 |
General Information | Image | Atlas Mapped | Tissue | Affy Data | GFP Data | Corelation/TPE Score
| | Row Number | Diagnostic Image
(click to enlarge) |  |  | Columella | 37.5 | 0.0593 | Correlation
|
| 15 of 111 | 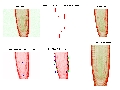 | Cortex | 52.83 | 0.079 | 0.501790642664128 |
| AGI Number | Endodermis | 48.1 | 0.0742 |
| AT1G52150 | Epidermis | 64.1 | 0.085 |
| File Name | Difference Image
(click to enlarge) | Lateral Root Cap | 65.43 | 0.1022 | TPE Score |
| 470-4-3strainormal |  | Pericycle | 312.73 | 0.0721 | 0.9101314 |
| Line Number | QC | 81.65 | 0.1102 |
| 470 | Stele | 440.6 | 0.1281 |
General Information | Image | Atlas Mapped | Tissue | Affy Data | GFP Data | Corelation/TPE Score
| | Row Number | Diagnostic Image
(click to enlarge) |  |  | Columella | NA | NA | Correlation
|
| 16 of 111 |  | Cortex | 52.83 | 0.0373 | 0.65612120241623 |
| AGI Number | Endodermis | 48.1 | 0.0329 |
| AT1G52150 | Epidermis | 64.1 | 0.0644 |
| File Name | Difference Image
(click to enlarge) | Lateral Root Cap | NA | NA | TPE Score |
| 471-1-2strainormal |  | Pericycle | 312.73 | 0.0459 | 0.9725451 |
| Line Number | QC | NA | NA |
| 471 | Stele | 440.6 | 0.0798 |
General Information | Image | Atlas Mapped | Tissue | Affy Data | GFP Data | Corelation/TPE Score
| | Row Number | Diagnostic Image
(click to enlarge) |  |  | Columella | NA | NA | Correlation
|
| 17 of 111 |  | Cortex | 52.83 | 0.0343 | 0.68455593447485 |
| AGI Number | Endodermis | 48.1 | 0.0344 |
| AT1G52150 | Epidermis | 64.1 | 0.0419 |
| File Name | Difference Image
(click to enlarge) | Lateral Root Cap | 65.43 | 0.0453 | TPE Score |
| 471-1-3strainormal |  | Pericycle | 312.73 | 0.0394 | 0.972134 |
| Line Number | QC | NA | NA |
| 471 | Stele | 440.6 | 0.0537 |
General Information | Image | Atlas Mapped | Tissue | Affy Data | GFP Data | Corelation/TPE Score
| | Row Number | Diagnostic Image
(click to enlarge) | 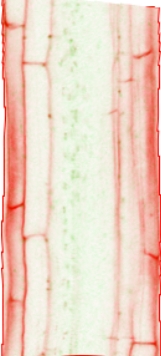 | 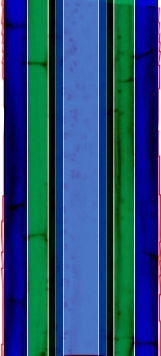 | Columella | NA | NA | Correlation
|
| 18 of 111 |  | Cortex | 18.4 | 0.0239 | 0.00292837352060613 |
| AGI Number | Endodermis | 4.2 | 0.0299 |
| AT5G52170 | Epidermis | 321.63 | 0.0325 |
| File Name | Difference Image
(click to enlarge) | Lateral Root Cap | NA | NA | TPE Score |
| 1261.16.3.1strainormal |  | Pericycle | 92.83 | 0.0307 | 0.9982812 |
| Line Number | QC | NA | NA |
| 1261 | Stele | 35.93 | 0.0475 |
General Information | Image | Atlas Mapped | Tissue | Affy Data | GFP Data | Corelation/TPE Score
| | Row Number | Diagnostic Image
(click to enlarge) | 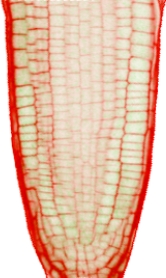 | 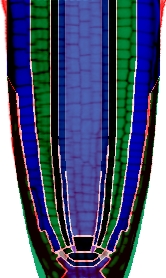 | Columella | 4.17 | 0.0777 | Correlation
|
| 19 of 111 |  | Cortex | 18.4 | 0.0651 | 0.361233030792191 |
| AGI Number | Endodermis | 4.2 | 0.049 |
| AT5G52170 | Epidermis | 321.63 | 0.0804 |
| File Name | Difference Image
(click to enlarge) | Lateral Root Cap | 107.97 | 0.0861 | TPE Score |
| 1261.12.2.1strainormal |  | Pericycle | 92.83 | 0.036 | 0.8829709 |
| Line Number | QC | 34.8 | 0.0678 |
| 1261 | Stele | 35.93 | 0.0372 |
General Information | Image | Atlas Mapped | Tissue | Affy Data | GFP Data | Corelation/TPE Score
| | Row Number | Diagnostic Image
(click to enlarge) | 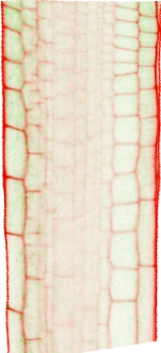 | 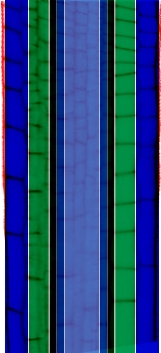 | Columella | NA | NA | Correlation
|
| 20 of 111 |  | Cortex | 18.4 | 0.0469 | 0.822696838920962 |
| AGI Number | Endodermis | 4.2 | 0.0311 |
| AT5G52170 | Epidermis | 321.63 | 0.0691 |
| File Name | Difference Image
(click to enlarge) | Lateral Root Cap | NA | NA | TPE Score |
| 1261.12.1.2strainormal |  | Pericycle | 92.83 | 0.0289 | 0.9767794 |
| Line Number | QC | NA | NA |
| 1261 | Stele | 35.93 | 0.0276 |
General Information | Image | Atlas Mapped | Tissue | Affy Data | GFP Data | Corelation/TPE Score
| | Row Number | Diagnostic Image
(click to enlarge) | 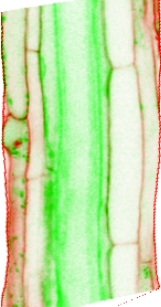 | 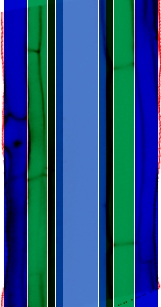 | Columella | NA | NA | Correlation
|
| 21 of 111 |  | Cortex | 2210.8 | 0.0576 | 0.391417674654205 |
| AGI Number | Endodermis | 380.2 | 0.2915 |
| AT4G27410 | Epidermis | 233.23 | 0.0654 |
| File Name | Difference Image
(click to enlarge) | Lateral Root Cap | NA | NA | TPE Score |
| 1167.1.1.4strainormal |  | Pericycle | 2890.23 | 0.4226 | 0.9358897 |
| Line Number | QC | NA | NA |
| 1167 | Stele | 1014.93 | 0.1993 |
General Information | Image | Atlas Mapped | Tissue | Affy Data | GFP Data | Corelation/TPE Score
| | Row Number | Diagnostic Image
(click to enlarge) |  | 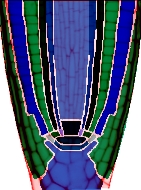 | Columella | 8.4 | 0.041 | Correlation
|
| 22 of 111 | 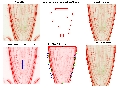 | Cortex | 21.57 | 0.0392 | 0.0925731339196578 |
| AGI Number | Endodermis | 68.87 | 0.0451 |
| AT5G60200 | Epidermis | 18.33 | 0.0397 |
| File Name | Difference Image
(click to enlarge) | Lateral Root Cap | 8.17 | 0.0599 | TPE Score |
| _822.2.5.1strainormal |  | Pericycle | 831.8 | 0.0497 | 0.978705 |
| Line Number | QC | 42.65 | 0.063 |
| 822 | Stele | 502.87 | 0.0498 |
General Information | Image | Atlas Mapped | Tissue | Affy Data | GFP Data | Corelation/TPE Score
| | Row Number | Diagnostic Image
(click to enlarge) |  | 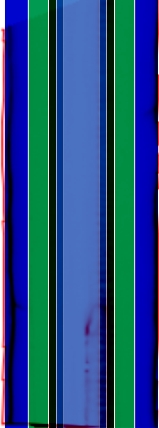 | Columella | NA | NA | Correlation
|
| 23 of 111 |  | Cortex | 21.57 | 0.1029 | 0.145276452746302 |
| AGI Number | Endodermis | 68.87 | 0.0978 |
| AT5G60200 | Epidermis | 18.33 | 0.0386 |
| File Name | Difference Image
(click to enlarge) | Lateral Root Cap | NA | NA | TPE Score |
| _822.2.2.3strainormal |  | Pericycle | 831.8 | 0.0926 | 0.7460317 |
| Line Number | QC | NA | NA |
| 822 | Stele | 502.87 | 0.069 |
General Information | Image | Atlas Mapped | Tissue | Affy Data | GFP Data | Corelation/TPE Score
| | Row Number | Diagnostic Image
(click to enlarge) |  | 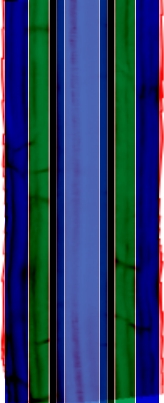 | Columella | NA | NA | Correlation
|
| 24 of 111 |  | Cortex | 21.57 | 0.0368 | 0.643065691981024 |
| AGI Number | Endodermis | 68.87 | 0.0559 |
| AT5G60200 | Epidermis | 18.33 | 0.0376 |
| File Name | Difference Image
(click to enlarge) | Lateral Root Cap | NA | NA | TPE Score |
| _822.2.2.2strainormal |  | Pericycle | 831.8 | 0.0906 | 0.9651942 |
| Line Number | QC | NA | NA |
| 822 | Stele | 502.87 | 0.1754 |
General Information | Image | Atlas Mapped | Tissue | Affy Data | GFP Data | Corelation/TPE Score
| | Row Number | Diagnostic Image
(click to enlarge) |  | 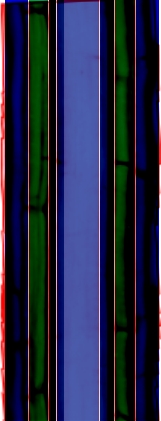 | Columella | NA | NA | Correlation
|
| 25 of 111 | 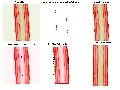 | Cortex | 21.57 | 0.0285 | 0.648810763172523 |
| AGI Number | Endodermis | 68.87 | 0.0358 |
| AT5G60200 | Epidermis | 18.33 | 0.027 |
| File Name | Difference Image
(click to enlarge) | Lateral Root Cap | NA | NA | TPE Score |
| _822.2.1.1strainormal |  | Pericycle | 831.8 | 0.0778 | 0.9995316 |
| Line Number | QC | NA | NA |
| 822 | Stele | 502.87 | 0.1605 |
General Information | Image | Atlas Mapped | Tissue | Affy Data | GFP Data | Corelation/TPE Score
| | Row Number | Diagnostic Image
(click to enlarge) |  |  | Columella | NA | NA | Correlation
|
| 26 of 111 |  | Cortex | 916.67 | 0.04 | -0.147402536091182 |
| AGI Number | Endodermis | 360.13 | 0.04 |
| AT5G15150 | Epidermis | 84.2 | 0.0369 |
| File Name | Difference Image
(click to enlarge) | Lateral Root Cap | NA | NA | TPE Score |
| 1181.1.3.1strainormal |  | Pericycle | 36.6 | 0.0381 | 0.9961628 |
| Line Number | QC | NA | NA |
| 1181 | Stele | 107.9 | 0.0537 |
General Information | Image | Atlas Mapped | Tissue | Affy Data | GFP Data | Corelation/TPE Score
| | Row Number | Diagnostic Image
(click to enlarge) |  | 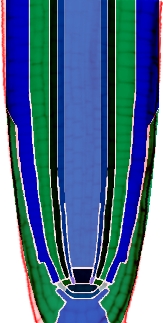 | Columella | 31.4 | 0.024 | Correlation
|
| 27 of 111 |  | Cortex | 916.67 | 0.0752 | 0.419953196563994 |
| AGI Number | Endodermis | 360.13 | 0.0646 |
| AT5G15150 | Epidermis | 84.2 | 0.0788 |
| File Name | Difference Image
(click to enlarge) | Lateral Root Cap | 85.33 | 0.0712 | TPE Score |
| 1181.1.2.1strainormal |  | Pericycle | 36.6 | 0.0563 | 0.9778112 |
| Line Number | QC | 130.35 | 0.0639 |
| 1181 | Stele | 107.9 | 0.0475 |
General Information | Image | Atlas Mapped | Tissue | Affy Data | GFP Data | Corelation/TPE Score
| | Row Number | Diagnostic Image
(click to enlarge) |  | 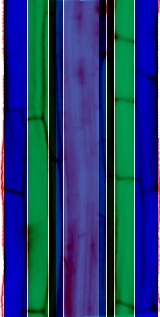 | Columella | NA | NA | Correlation
|
| 28 of 111 |  | Cortex | 916.67 | 0.064 | 0.451666921817131 |
| AGI Number | Endodermis | 360.13 | 0.0526 |
| AT5G15150 | Epidermis | 84.2 | 0.0695 |
| File Name | Difference Image
(click to enlarge) | Lateral Root Cap | NA | NA | TPE Score |
| 1181.1.4.2strainormal |  | Pericycle | 36.6 | 0.0418 | 0.964808 |
| Line Number | QC | NA | NA |
| 1181 | Stele | 107.9 | 0.0385 |
General Information | Image | Atlas Mapped | Tissue | Affy Data | GFP Data | Corelation/TPE Score
| | Row Number | Diagnostic Image
(click to enlarge) | 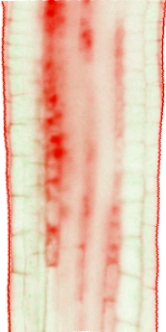 |  | Columella | NA | NA | Correlation
|
| 29 of 111 |  | Cortex | 916.67 | 0.0537 | 0.672564343317507 |
| AGI Number | Endodermis | 360.13 | 0.0454 |
| AT5G15150 | Epidermis | 84.2 | 0.0512 |
| File Name | Difference Image
(click to enlarge) | Lateral Root Cap | NA | NA | TPE Score |
| 1181.1.4.1strainormal |  | Pericycle | 36.6 | 0.0412 | 0.9334761 |
| Line Number | QC | NA | NA |
| 1181 | Stele | 107.9 | 0.0391 |
General Information | Image | Atlas Mapped | Tissue | Affy Data | GFP Data | Corelation/TPE Score
| | Row Number | Diagnostic Image
(click to enlarge) |  | 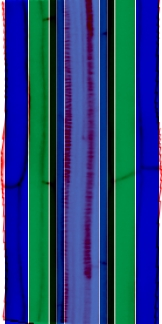 | Columella | NA | NA | Correlation
|
| 30 of 111 | 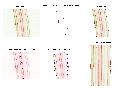 | Cortex | 695.3 | 0.0246 | 0.36517642375474 |
| AGI Number | Endodermis | 87.47 | 0.0229 |
| AT3G29035 | Epidermis | 491.83 | 0.0797 |
| File Name | Difference Image
(click to enlarge) | Lateral Root Cap | NA | NA | TPE Score |
| 1246.1.1.4strainormal |  | Pericycle | 33.87 | 0.026 | 0.8977134 |
| Line Number | QC | NA | NA |
| 1246 | Stele | 225.2 | 0.0265 |
General Information | Image | Atlas Mapped | Tissue | Affy Data | GFP Data | Corelation/TPE Score
| | Row Number | Diagnostic Image
(click to enlarge) |  | 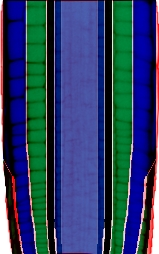 | Columella | NA | NA | Correlation
|
| 31 of 111 |  | Cortex | 695.3 | 0.0216 | 0.468048495692606 |
| AGI Number | Endodermis | 87.47 | 0.015 |
| AT3G29035 | Epidermis | 491.83 | 0.0634 |
| File Name | Difference Image
(click to enlarge) | Lateral Root Cap | 40.4 | 0.0234 | TPE Score |
| 1246.2.2.2strainormal |  | Pericycle | 33.87 | 0.0145 | 0.9935773 |
| Line Number | QC | NA | NA |
| 1246 | Stele | 225.2 | 0.0128 |
General Information | Image | Atlas Mapped | Tissue | Affy Data | GFP Data | Corelation/TPE Score
| | Row Number | Diagnostic Image
(click to enlarge) | 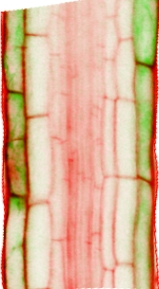 | 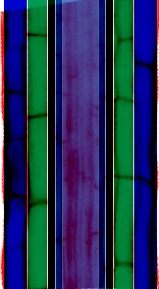 | Columella | NA | NA | Correlation
|
| 32 of 111 |  | Cortex | 695.3 | 0.0341 | 0.482424771862201 |
| AGI Number | Endodermis | 87.47 | 0.0039 |
| AT3G29035 | Epidermis | 491.83 | 0.2422 |
| File Name | Difference Image
(click to enlarge) | Lateral Root Cap | NA | NA | TPE Score |
| 1246.1.3.3strainormal |  | Pericycle | 33.87 | 0.0019 | 0.9929949 |
| Line Number | QC | NA | NA |
| 1246 | Stele | 225.2 | 0.0012 |
General Information | Image | Atlas Mapped | Tissue | Affy Data | GFP Data | Corelation/TPE Score
| | Row Number | Diagnostic Image
(click to enlarge) |  |  | Columella | 60.33 | 0.009 | Correlation
|
| 33 of 111 |  | Cortex | 695.3 | 0.046 | 0.758633157497666 |
| AGI Number | Endodermis | 87.47 | 0.0187 |
| AT3G29035 | Epidermis | 491.83 | 0.0625 |
| File Name | Difference Image
(click to enlarge) | Lateral Root Cap | 40.4 | 0.0326 | TPE Score |
| 1246.1.1.1strainormal |  | Pericycle | 33.87 | 0.0152 | 0.7823305 |
| Line Number | QC | 309.7 | 0.0309 |
| 1246 | Stele | 225.2 | 0.0126 |
General Information | Image | Atlas Mapped | Tissue | Affy Data | GFP Data | Corelation/TPE Score
| | Row Number | Diagnostic Image
(click to enlarge) |  |  | Columella | NA | NA | Correlation
|
| 34 of 111 |  | Cortex | 2.53 | 0.0702 | 0.544107598038181 |
| AGI Number | Endodermis | 394.67 | 0.3124 |
| AT4G21340 | Epidermis | 12.73 | 0 |
| File Name | Difference Image
(click to enlarge) | Lateral Root Cap | NA | NA | TPE Score |
| 843.3.1.4strainormal |  | Pericycle | 2.4 | 0.2371 | 0.987919 |
| Line Number | QC | NA | NA |
| 843 | Stele | 185.73 | 0.0267 |
General Information | Image | Atlas Mapped | Tissue | Affy Data | GFP Data | Corelation/TPE Score
| | Row Number | Diagnostic Image
(click to enlarge) |  |  | Columella | NA | NA | Correlation
|
| 35 of 111 |  | Cortex | 2.53 | 0.0575 | 0.600678999161289 |
| AGI Number | Endodermis | 394.67 | 0.2239 |
| AT4G21340 | Epidermis | 12.73 | 0 |
| File Name | Difference Image
(click to enlarge) | Lateral Root Cap | NA | NA | TPE Score |
| 843.3.1.2strainormal |  | Pericycle | 2.4 | 0.1547 | 0.8670423 |
| Line Number | QC | NA | NA |
| 843 | Stele | 185.73 | 0.0296 |
General Information | Image | Atlas Mapped | Tissue | Affy Data | GFP Data | Corelation/TPE Score
| | Row Number | Diagnostic Image
(click to enlarge) |  |  | Columella | NA | NA | Correlation
|
| 36 of 111 |  | Cortex | 32.83 | 0.0871 | 0.585251793719265 |
| AGI Number | Endodermis | 602.83 | 0.1125 |
| AT4G32710 | Epidermis | 24.1 | 0.0942 |
| File Name | Difference Image
(click to enlarge) | Lateral Root Cap | 35.9 | 0.0869 | TPE Score |
| _353.2.1.1strainormal |  | Pericycle | 90.73 | 0.1174 | 0.9818148 |
| Line Number | QC | NA | NA |
| 353 | Stele | 212.43 | 0.1071 |
General Information | Image | Atlas Mapped | Tissue | Affy Data | GFP Data | Corelation/TPE Score
| | Row Number | Diagnostic Image
(click to enlarge) |  |  | Columella | 600.13 | 0.0457 | Correlation
|
| 37 of 111 |  | Cortex | 1251.23 | 0.0474 | 0.0252926625403084 |
| AGI Number | Endodermis | 342.5 | 0.0425 |
| AT4G16190 | Epidermis | 1140.4 | 0.0554 |
| File Name | Difference Image
(click to enlarge) | Lateral Root Cap | 404.07 | 0.0677 | TPE Score |
| 155-2-1strainormal | 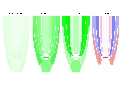 | Pericycle | 126.3 | 0.0323 | 0.8806024 |
| Line Number | QC | 291 | 0.0926 |
| 155 | Stele | 353.8 | 0.0241 |
General Information | Image | Atlas Mapped | Tissue | Affy Data | GFP Data | Corelation/TPE Score
| | Row Number | Diagnostic Image
(click to enlarge) | 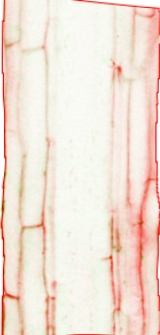 | 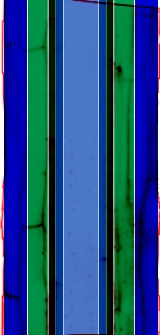 | Columella | NA | NA | Correlation
|
| 38 of 111 |  | Cortex | 1251.23 | 0.0288 | 0.610624607420713 |
| AGI Number | Endodermis | 342.5 | 0.0325 |
| AT4G16190 | Epidermis | 1140.4 | 0.0342 |
| File Name | Difference Image
(click to enlarge) | Lateral Root Cap | NA | NA | TPE Score |
| 155-1-5strainormal |  | Pericycle | 126.3 | 0.0163 | 0.9178874 |
| Line Number | QC | NA | NA |
| 155 | Stele | 353.8 | 0.0094 |
General Information | Image | Atlas Mapped | Tissue | Affy Data | GFP Data | Corelation/TPE Score
| | Row Number | Diagnostic Image
(click to enlarge) |  |  | Columella | 600.13 | 0.0473 | Correlation
|
| 39 of 111 |  | Cortex | 1251.23 | 0.0625 | 0.784885179989848 |
| AGI Number | Endodermis | 342.5 | 0.0534 |
| AT4G16190 | Epidermis | 1140.4 | 0.0595 |
| File Name | Difference Image
(click to enlarge) | Lateral Root Cap | 404.07 | 0.052 | TPE Score |
| 156-1-2strainormal | 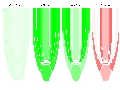 | Pericycle | 126.3 | 0.0401 | 0.9034571 |
| Line Number | QC | 291 | 0.0465 |
| 156 | Stele | 353.8 | 0.034 |
General Information | Image | Atlas Mapped | Tissue | Affy Data | GFP Data | Corelation/TPE Score
| | Row Number | Diagnostic Image
(click to enlarge) | 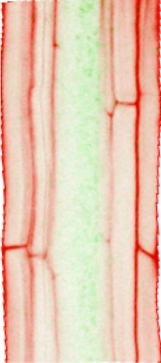 | 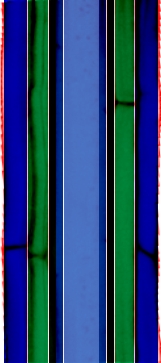 | Columella | NA | NA | Correlation
|
| 40 of 111 |  | Cortex | 16.17 | 0.0279 | 0.236785381394509 |
| AGI Number | Endodermis | 264.2 | 0.0431 |
| AT4G00940 | Epidermis | 12.63 | 0.0363 |
| File Name | Difference Image
(click to enlarge) | Lateral Root Cap | NA | NA | TPE Score |
| 365-1-3strainormal | 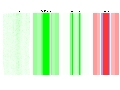 | Pericycle | 548.5 | 0.0555 | 0.966232 |
| Line Number | QC | NA | NA |
| 365 | Stele | 114.67 | 0.0873 |
General Information | Image | Atlas Mapped | Tissue | Affy Data | GFP Data | Corelation/TPE Score
| | Row Number | Diagnostic Image
(click to enlarge) | 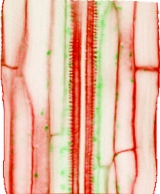 |  | Columella | NA | NA | Correlation
|
| 41 of 111 |  | Cortex | 16.17 | 0.028 | 0.486823584849119 |
| AGI Number | Endodermis | 264.2 | 0.0458 |
| AT4G00940 | Epidermis | 12.63 | 0.0229 |
| File Name | Difference Image
(click to enlarge) | Lateral Root Cap | NA | NA | TPE Score |
| _362.4.1.4strainormal | 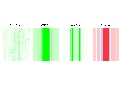 | Pericycle | 548.5 | 0.0836 | 0.9722405 |
| Line Number | QC | NA | NA |
| 362 | Stele | 114.67 | 0.1073 |
General Information | Image | Atlas Mapped | Tissue | Affy Data | GFP Data | Corelation/TPE Score
| | Row Number | Diagnostic Image
(click to enlarge) | 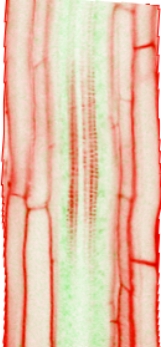 | 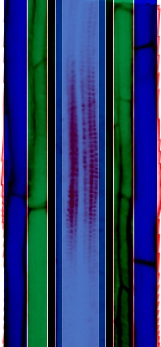 | Columella | NA | NA | Correlation
|
| 42 of 111 |  | Cortex | 16.17 | 0.033 | 0.63199566104471 |
| AGI Number | Endodermis | 264.2 | 0.0485 |
| AT4G00940 | Epidermis | 12.63 | 0.0303 |
| File Name | Difference Image
(click to enlarge) | Lateral Root Cap | NA | NA | TPE Score |
| 365-1-2strainormal |  | Pericycle | 548.5 | 0.0818 | 0.9965797 |
| Line Number | QC | NA | NA |
| 365 | Stele | 114.67 | 0.0858 |
General Information | Image | Atlas Mapped | Tissue | Affy Data | GFP Data | Corelation/TPE Score
| | Row Number | Diagnostic Image
(click to enlarge) | 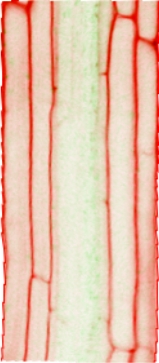 | 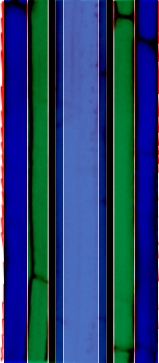 | Columella | NA | NA | Correlation
|
| 43 of 111 |  | Cortex | 16.17 | 0.033 | 0.652878938332265 |
| AGI Number | Endodermis | 264.2 | 0.0525 |
| AT4G00940 | Epidermis | 12.63 | 0.036 |
| File Name | Difference Image
(click to enlarge) | Lateral Root Cap | NA | NA | TPE Score |
| 365-1-4strainormal |  | Pericycle | 548.5 | 0.0625 | 0.9713467 |
| Line Number | QC | NA | NA |
| 365 | Stele | 114.67 | 0.0664 |
General Information | Image | Atlas Mapped | Tissue | Affy Data | GFP Data | Corelation/TPE Score
| | Row Number | Diagnostic Image
(click to enlarge) | 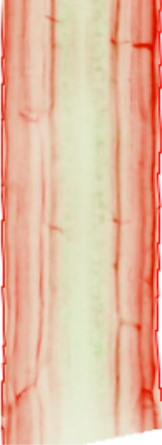 | 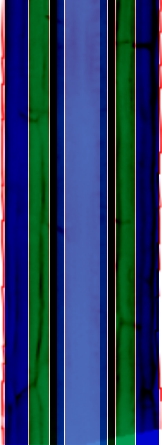 | Columella | NA | NA | Correlation
|
| 44 of 111 |  | Cortex | 16.17 | 0.0445 | 0.657997104577119 |
| AGI Number | Endodermis | 264.2 | 0.0616 |
| AT4G00940 | Epidermis | 12.63 | 0.0515 |
| File Name | Difference Image
(click to enlarge) | Lateral Root Cap | NA | NA | TPE Score |
| _363.2.1.1strainormal |  | Pericycle | 548.5 | 0.0711 | 0.9678788 |
| Line Number | QC | NA | NA |
| 363 | Stele | 114.67 | 0.0732 |
General Information | Image | Atlas Mapped | Tissue | Affy Data | GFP Data | Corelation/TPE Score
| | Row Number | Diagnostic Image
(click to enlarge) | 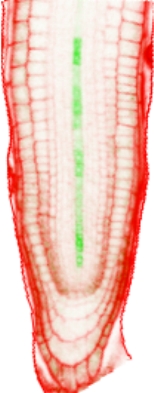 | 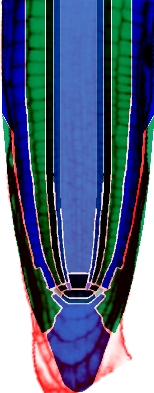 | Columella | 46.33 | 0.0252 | Correlation
|
| 45 of 111 | 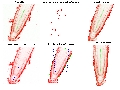 | Cortex | 14.97 | 0.0222 | 0.648169407675212 |
| AGI Number | Endodermis | 33.43 | 0.0129 |
| AT4G28140 | Epidermis | 19.1 | 0.0309 |
| File Name | Difference Image
(click to enlarge) | Lateral Root Cap | 82.23 | 0.045 | TPE Score |
| _612_2_12strainormal |  | Pericycle | 77.17 | 0.0029 | 0.748141 |
| Line Number | QC | 44.65 | 0.0432 |
| 612 | Stele | 238.67 | 0.0629 |
General Information | Image | Atlas Mapped | Tissue | Affy Data | GFP Data | Corelation/TPE Score
| | Row Number | Diagnostic Image
(click to enlarge) | 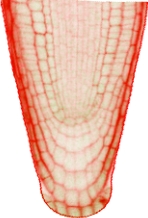 | 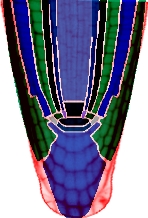 | Columella | 274.57 | 0.0478 | Correlation
|
| 46 of 111 |  | Cortex | 81.83 | 0.0523 | 0.358021945437216 |
| AGI Number | Endodermis | 47 | 0.0491 |
| AT1G30650 | Epidermis | 127.97 | 0.0517 |
| File Name | Difference Image
(click to enlarge) | Lateral Root Cap | 282.87 | 0.0628 | TPE Score |
| 238-1-4strainormal |  | Pericycle | 34.87 | 0.0334 | 0.9581838 |
| Line Number | QC | 74.25 | 0.062 |
| 238 | Stele | 99.2 | 0.0233 |
General Information | Image | Atlas Mapped | Tissue | Affy Data | GFP Data | Corelation/TPE Score
| | Row Number | Diagnostic Image
(click to enlarge) | 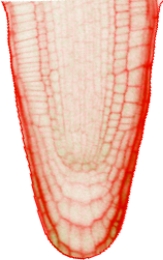 | 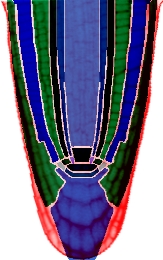 | Columella | 274.57 | 0.0473 | Correlation
|
| 47 of 111 |  | Cortex | 81.83 | 0.0396 | 0.480385599972346 |
| AGI Number | Endodermis | 47 | 0.0387 |
| AT1G30650 | Epidermis | 127.97 | 0.0367 |
| File Name | Difference Image
(click to enlarge) | Lateral Root Cap | 282.87 | 0.0648 | TPE Score |
| 238-2-3strainormal |  | Pericycle | 34.87 | 0.0253 | 0.9649185 |
| Line Number | QC | 74.25 | 0.0681 |
| 238 | Stele | 99.2 | 0.0239 |
General Information | Image | Atlas Mapped | Tissue | Affy Data | GFP Data | Corelation/TPE Score
| | Row Number | Diagnostic Image
(click to enlarge) | 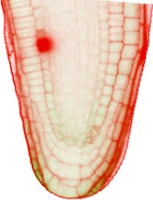 |  | Columella | 274.57 | 0.0798 | Correlation
|
| 48 of 111 |  | Cortex | 81.83 | 0.0466 | 0.575235940043036 |
| AGI Number | Endodermis | 47 | 0.0427 |
| AT1G30650 | Epidermis | 127.97 | 0.0494 |
| File Name | Difference Image
(click to enlarge) | Lateral Root Cap | 282.87 | 0.0769 | TPE Score |
| 239-1-4strainormal |  | Pericycle | 34.87 | 0.0249 | 0.9661538 |
| Line Number | QC | 74.25 | 0.09 |
| 239 | Stele | 99.2 | 0.0163 |
General Information | Image | Atlas Mapped | Tissue | Affy Data | GFP Data | Corelation/TPE Score
| | Row Number | Diagnostic Image
(click to enlarge) |  | 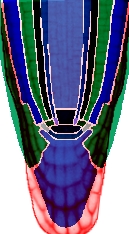 | Columella | 274.57 | 0.0569 | Correlation
|
| 49 of 111 |  | Cortex | 81.83 | 0.0307 | 0.664349813706442 |
| AGI Number | Endodermis | 47 | 0.0298 |
| AT1G30650 | Epidermis | 127.97 | 0.0375 |
| File Name | Difference Image
(click to enlarge) | Lateral Root Cap | 282.87 | 0.0372 | TPE Score |
| 238-1-1strainormal |  | Pericycle | 34.87 | 0.0199 | 0.8694693 |
| Line Number | QC | 74.25 | 0.0422 |
| 238 | Stele | 99.2 | 0.018 |
General Information | Image | Atlas Mapped | Tissue | Affy Data | GFP Data | Corelation/TPE Score
| | Row Number | Diagnostic Image
(click to enlarge) |  | 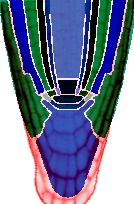 | Columella | 274.57 | 0.0906 | Correlation
|
| 50 of 111 |  | Cortex | 81.83 | 0.0459 | 0.686583222504081 |
| AGI Number | Endodermis | 47 | 0.0492 |
| AT1G30650 | Epidermis | 127.97 | 0.0406 |
| File Name | Difference Image
(click to enlarge) | Lateral Root Cap | 282.87 | 0.0703 | TPE Score |
| 239-1-1strainormal |  | Pericycle | 34.87 | 0.0299 | 0.9262258 |
| Line Number | QC | 74.25 | 0.0711 |
| 239 | Stele | 99.2 | 0.0212 |
General Information | Image | Atlas Mapped | Tissue | Affy Data | GFP Data | Corelation/TPE Score
| | Row Number | Diagnostic Image
(click to enlarge) |  | 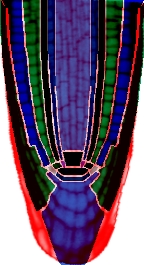 | Columella | 274.57 | 0.0939 | Correlation
|
| 51 of 111 | 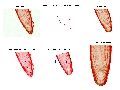 | Cortex | 81.83 | 0.0751 | 0.73948218555528 |
| AGI Number | Endodermis | 47 | 0.0623 |
| AT1G30650 | Epidermis | 127.97 | 0.0848 |
| File Name | Difference Image
(click to enlarge) | Lateral Root Cap | 282.87 | 0.1077 | TPE Score |
| 239-2-1strainormal |  | Pericycle | 34.87 | 0.0483 | 0.9111885 |
| Line Number | QC | 74.25 | 0.0877 |
| 239 | Stele | 99.2 | 0.0408 |
General Information | Image | Atlas Mapped | Tissue | Affy Data | GFP Data | Corelation/TPE Score
| | Row Number | Diagnostic Image
(click to enlarge) | 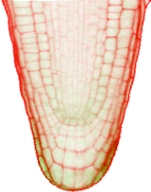 | 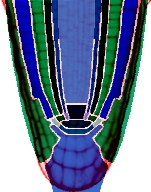 | Columella | 274.57 | 0.0897 | Correlation
|
| 52 of 111 |  | Cortex | 81.83 | 0.0394 | 0.769724400807501 |
| AGI Number | Endodermis | 47 | 0.0335 |
| AT1G30650 | Epidermis | 127.97 | 0.0418 |
| File Name | Difference Image
(click to enlarge) | Lateral Root Cap | 282.87 | 0.0756 | TPE Score |
| 239-1-3strainormal |  | Pericycle | 34.87 | 0.0204 | 0.9713112 |
| Line Number | QC | 74.25 | 0.0668 |
| 239 | Stele | 99.2 | 0.0093 |
General Information | Image | Atlas Mapped | Tissue | Affy Data | GFP Data | Corelation/TPE Score
| | Row Number | Diagnostic Image
(click to enlarge) |  | 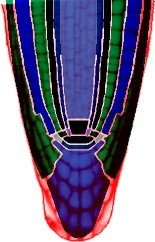 | Columella | 274.57 | 0.063 | Correlation
|
| 53 of 111 |  | Cortex | 81.83 | 0.0336 | 0.786103750906324 |
| AGI Number | Endodermis | 47 | 0.0261 |
| AT1G30650 | Epidermis | 127.97 | 0.0341 |
| File Name | Difference Image
(click to enlarge) | Lateral Root Cap | 282.87 | 0.0618 | TPE Score |
| 238-1-2strainormal |  | Pericycle | 34.87 | 0.0157 | 0.9786191 |
| Line Number | QC | 74.25 | 0.0517 |
| 238 | Stele | 99.2 | 0.0117 |
General Information | Image | Atlas Mapped | Tissue | Affy Data | GFP Data | Corelation/TPE Score
| | Row Number | Diagnostic Image
(click to enlarge) | 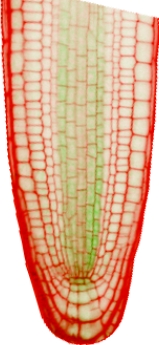 | 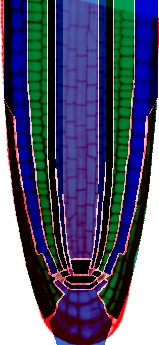 | Columella | 517.03 | 0.1393 | Correlation
|
| 54 of 111 | 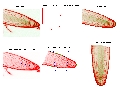 | Cortex | 26.23 | 0.0347 | 0.664316290169735 |
| AGI Number | Endodermis | 12.43 | 0.0363 |
| AT4G32880 | Epidermis | 30.7 | 0.0449 |
| File Name | Difference Image
(click to enlarge) | Lateral Root Cap | 22.97 | 0.0747 | TPE Score |
| _591.1.1.1strainormal |  | Pericycle | 198.7 | 0.1209 | 0.8059191 |
| Line Number | QC | 292.6 | 0.2507 |
| 591 | Stele | 516.67 | 0.1357 |
General Information | Image | Atlas Mapped | Tissue | Affy Data | GFP Data | Corelation/TPE Score
| | Row Number | Diagnostic Image
(click to enlarge) |  | 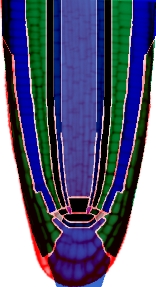 | Columella | 517.03 | 0.1451 | Correlation
|
| 55 of 111 |  | Cortex | 26.23 | 0.0175 | 0.693302149555775 |
| AGI Number | Endodermis | 12.43 | 0.022 |
| AT4G32880 | Epidermis | 30.7 | 0.0195 |
| File Name | Difference Image
(click to enlarge) | Lateral Root Cap | 22.97 | 0.0443 | TPE Score |
| _591.1.2.1strainormal |  | Pericycle | 198.7 | 0.0939 | 0.9009124 |
| Line Number | QC | 292.6 | 0.287 |
| 591 | Stele | 516.67 | 0.1495 |
General Information | Image | Atlas Mapped | Tissue | Affy Data | GFP Data | Corelation/TPE Score
| | Row Number | Diagnostic Image
(click to enlarge) | 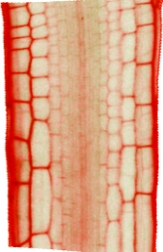 | 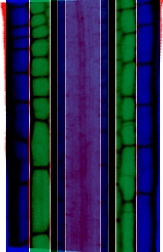 | Columella | NA | NA | Correlation
|
| 56 of 111 |  | Cortex | 26.23 | 0.0623 | 0.786300605367202 |
| AGI Number | Endodermis | 12.43 | 0.0573 |
| AT4G32880 | Epidermis | 30.7 | 0.0817 |
| File Name | Difference Image
(click to enlarge) | Lateral Root Cap | NA | NA | TPE Score |
| 591_1_14strainormal |  | Pericycle | 198.7 | 0.0725 | 0.9895114 |
| Line Number | QC | NA | NA |
| 591 | Stele | 516.67 | 0.0933 |
General Information | Image | Atlas Mapped | Tissue | Affy Data | GFP Data | Corelation/TPE Score
| | Row Number | Diagnostic Image
(click to enlarge) |  |  | Columella | NA | NA | Correlation
|
| 57 of 111 |  | Cortex | 26.23 | 0.0569 | 0.936759479200688 |
| AGI Number | Endodermis | 12.43 | 0.0525 |
| AT4G32880 | Epidermis | 30.7 | 0.0745 |
| File Name | Difference Image
(click to enlarge) | Lateral Root Cap | NA | NA | TPE Score |
| 591_1_15strainormal |  | Pericycle | 198.7 | 0.0749 | 0.9995627 |
| Line Number | QC | NA | NA |
| 591 | Stele | 516.67 | 0.1096 |
General Information | Image | Atlas Mapped | Tissue | Affy Data | GFP Data | Corelation/TPE Score
| | Row Number | Diagnostic Image
(click to enlarge) |  | 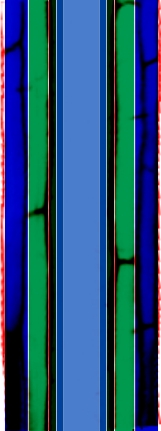 | Columella | NA | NA | Correlation
|
| 58 of 111 |  | Cortex | 91.9 | 0 | 0.810392946164319 |
| AGI Number | Endodermis | 840.23 | 0.0063 |
| AT2G38010 | Epidermis | 359.5 | 0.0029 |
| File Name | Difference Image
(click to enlarge) | Lateral Root Cap | NA | NA | TPE Score |
| _792_1_21strainormal |  | Pericycle | 1531.67 | 0.2657 | 0.9838634 |
| Line Number | QC | NA | NA |
| 792 | Stele | 367.53 | 0.0999 |
General Information | Image | Atlas Mapped | Tissue | Affy Data | GFP Data | Corelation/TPE Score
| | Row Number | Diagnostic Image
(click to enlarge) | 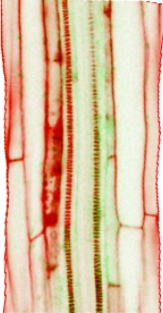 | 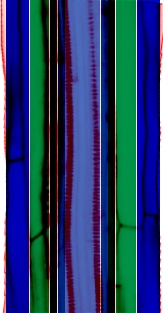 | Columella | NA | NA | Correlation
|
| 59 of 111 |  | Cortex | 85 | 0.0371 | 0.719044931326991 |
| AGI Number | Endodermis | 362.17 | 0.1161 |
| AT5G24380 | Epidermis | 129.7 | 0.0278 |
| File Name | Difference Image
(click to enlarge) | Lateral Root Cap | NA | NA | TPE Score |
| 551-1-1strainormal |  | Pericycle | 377.3 | 0.1488 | 0.9546374 |
| Line Number | QC | NA | NA |
| 551 | Stele | 151.07 | 0.1362 |
General Information | Image | Atlas Mapped | Tissue | Affy Data | GFP Data | Corelation/TPE Score
| | Row Number | Diagnostic Image
(click to enlarge) |  | 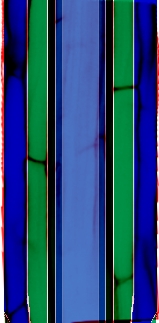 | Columella | NA | NA | Correlation
|
| 60 of 111 |  | Cortex | 85 | 0.0102 | 0.754305992421412 |
| AGI Number | Endodermis | 362.17 | 0.2456 |
| AT5G24380 | Epidermis | 129.7 | 0.0116 |
| File Name | Difference Image
(click to enlarge) | Lateral Root Cap | 121.07 | 0.0131 | TPE Score |
| 551-1-6strainormal |  | Pericycle | 377.3 | 0.2985 | 0.9691842 |
| Line Number | QC | NA | NA |
| 551 | Stele | 151.07 | 0.2879 |
General Information | Image | Atlas Mapped | Tissue | Affy Data | GFP Data | Corelation/TPE Score
| | Row Number | Diagnostic Image
(click to enlarge) |  | 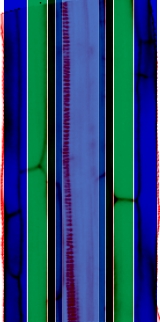 | Columella | NA | NA | Correlation
|
| 61 of 111 |  | Cortex | 85 | 0.0253 | 0.874624271719913 |
| AGI Number | Endodermis | 362.17 | 0.1843 |
| AT5G24380 | Epidermis | 129.7 | 0.0273 |
| File Name | Difference Image
(click to enlarge) | Lateral Root Cap | NA | NA | TPE Score |
| 551-1-2strainormal |  | Pericycle | 377.3 | 0.2093 | 0.9553046 |
| Line Number | QC | NA | NA |
| 551 | Stele | 151.07 | 0.1509 |
General Information | Image | Atlas Mapped | Tissue | Affy Data | GFP Data | Corelation/TPE Score
| | Row Number | Diagnostic Image
(click to enlarge) |  |  | Columella | NA | NA | Correlation
|
| 62 of 111 |  | Cortex | 85 | 0.0181 | 0.909606964691803 |
| AGI Number | Endodermis | 362.17 | 0.2063 |
| AT5G24380 | Epidermis | 129.7 | 0.0129 |
| File Name | Difference Image
(click to enlarge) | Lateral Root Cap | NA | NA | TPE Score |
| 551-1-3strainormal |  | Pericycle | 377.3 | 0.2825 | 0.9996664 |
| Line Number | QC | NA | NA |
| 551 | Stele | 151.07 | 0.1493 |
General Information | Image | Atlas Mapped | Tissue | Affy Data | GFP Data | Corelation/TPE Score
| | Row Number | Diagnostic Image
(click to enlarge) |  | 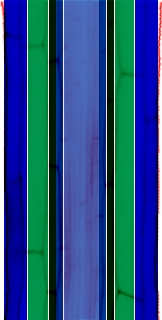 | Columella | NA | NA | Correlation
|
| 63 of 111 |  | Cortex | 74.5 | 0.0203 | 0.6839839250566 |
| AGI Number | Endodermis | 233.2 | 0.0216 |
| AT5G60690 | Epidermis | 41.77 | 0.0334 |
| File Name | Difference Image
(click to enlarge) | Lateral Root Cap | NA | NA | TPE Score |
| 840.2.1.2strainormal |  | Pericycle | 438.7 | 0.0333 | 0.6455564 |
| Line Number | QC | NA | NA |
| 840 | Stele | 512.97 | 0.0496 |
General Information | Image | Atlas Mapped | Tissue | Affy Data | GFP Data | Corelation/TPE Score
| | Row Number | Diagnostic Image
(click to enlarge) |  | 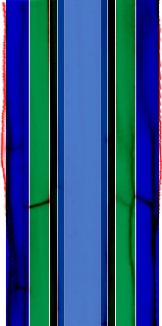 | Columella | NA | NA | Correlation
|
| 64 of 111 |  | Cortex | 74.5 | 0.0173 | 0.716606392687031 |
| AGI Number | Endodermis | 233.2 | 0.0373 |
| AT5G60690 | Epidermis | 41.77 | 0.0264 |
| File Name | Difference Image
(click to enlarge) | Lateral Root Cap | NA | NA | TPE Score |
| 840.2.3.1strainormal |  | Pericycle | 438.7 | 0.027 | 0.9753458 |
| Line Number | QC | NA | NA |
| 840 | Stele | 512.97 | 0.0541 |
General Information | Image | Atlas Mapped | Tissue | Affy Data | GFP Data | Corelation/TPE Score
| | Row Number | Diagnostic Image
(click to enlarge) |  | 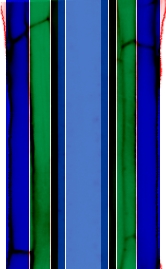 | Columella | NA | NA | Correlation
|
| 65 of 111 |  | Cortex | 74.5 | 0.0249 | 0.924413449706748 |
| AGI Number | Endodermis | 233.2 | 0.0251 |
| AT5G60690 | Epidermis | 41.77 | 0.0192 |
| File Name | Difference Image
(click to enlarge) | Lateral Root Cap | NA | NA | TPE Score |
| 838.2.1.1strainormal |  | Pericycle | 438.7 | 0.0302 | 0.9531051 |
| Line Number | QC | NA | NA |
| 838 | Stele | 512.97 | 0.0376 |
General Information | Image | Atlas Mapped | Tissue | Affy Data | GFP Data | Corelation/TPE Score
| | Row Number | Diagnostic Image
(click to enlarge) |  | 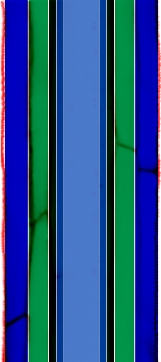 | Columella | NA | NA | Correlation
|
| 66 of 111 |  | Cortex | 74.5 | 0.0234 | 0.928276016767436 |
| AGI Number | Endodermis | 233.2 | 0.0339 |
| AT5G60690 | Epidermis | 41.77 | 0.0222 |
| File Name | Difference Image
(click to enlarge) | Lateral Root Cap | NA | NA | TPE Score |
| 840.2.2.1strainormal |  | Pericycle | 438.7 | 0.0363 | 0.9979703 |
| Line Number | QC | NA | NA |
| 840 | Stele | 512.97 | 0.0532 |
General Information | Image | Atlas Mapped | Tissue | Affy Data | GFP Data | Corelation/TPE Score
| | Row Number | Diagnostic Image
(click to enlarge) |  | 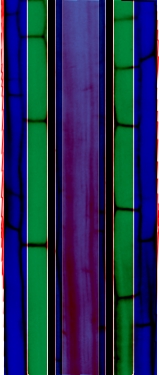 | Columella | NA | NA | Correlation
|
| 67 of 111 | 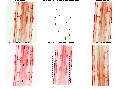 | Cortex | 12.07 | 0.0261 | 0.825484455736824 |
| AGI Number | Endodermis | 30.77 | 0.0454 |
| AT1G71692 | Epidermis | 35.27 | 0.044 |
| File Name | Difference Image
(click to enlarge) | Lateral Root Cap | NA | NA | TPE Score |
| 978_1_21strainormal | 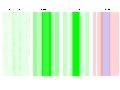 | Pericycle | 98.07 | 0.1087 | 0.9765047 |
| Line Number | QC | NA | NA |
| 978 | Stele | 151.33 | 0.084 |
General Information | Image | Atlas Mapped | Tissue | Affy Data | GFP Data | Corelation/TPE Score
| | Row Number | Diagnostic Image
(click to enlarge) | 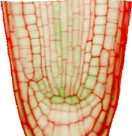 | 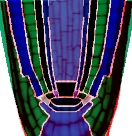 | Columella | 83.43 | 0.0512 | Correlation
|
| 68 of 111 | 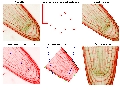 | Cortex | 4.5 | 0.0805 | 0.87296232813594 |
| AGI Number | Endodermis | 18.2 | 0.0698 |
| AT1G68640 | Epidermis | 2.87 | 0.0819 |
| File Name | Difference Image
(click to enlarge) | Lateral Root Cap | 10.33 | 0.1152 | TPE Score |
| _935.1.1strainormal | 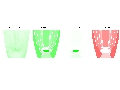 | Pericycle | 5.53 | 0.0479 | 0.968043 |
| Line Number | QC | 1028.15 | 0.1942 |
| 935 | Stele | 21.07 | 0.0885 |
General Information | Image | Atlas Mapped | Tissue | Affy Data | GFP Data | Corelation/TPE Score
| | Row Number | Diagnostic Image
(click to enlarge) | 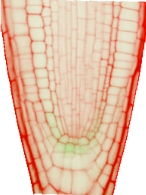 | 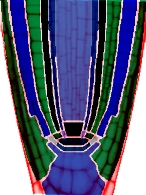 | Columella | 83.43 | 0.0702 | Correlation
|
| 69 of 111 |  | Cortex | 4.5 | 0.06 | 0.920484718329049 |
| AGI Number | Endodermis | 18.2 | 0.0537 |
| AT1G68640 | Epidermis | 2.87 | 0.0542 |
| File Name | Difference Image
(click to enlarge) | Lateral Root Cap | 10.33 | 0.0753 | TPE Score |
| _939.1.3strainormal |  | Pericycle | 5.53 | 0.0421 | 0.9003047 |
| Line Number | QC | 1028.15 | 0.1342 |
| 939 | Stele | 21.07 | 0.039 |
General Information | Image | Atlas Mapped | Tissue | Affy Data | GFP Data | Corelation/TPE Score
| | Row Number | Diagnostic Image
(click to enlarge) |  | 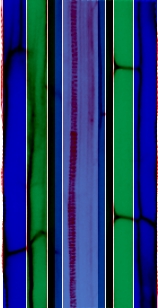 | Columella | NA | NA | Correlation
|
| 70 of 111 |  | Cortex | 51.23 | 0.0211 | 0.832455692399783 |
| AGI Number | Endodermis | 104.6 | 0.0243 |
| AT2G28810 | Epidermis | 54.3 | 0.0261 |
| File Name | Difference Image
(click to enlarge) | Lateral Root Cap | NA | NA | TPE Score |
| 740.1.3.2strainormal |  | Pericycle | 250.73 | 0.031 | 0.9271969 |
| Line Number | QC | NA | NA |
| 740 | Stele | 313.03 | 0.0682 |
General Information | Image | Atlas Mapped | Tissue | Affy Data | GFP Data | Corelation/TPE Score
| | Row Number | Diagnostic Image
(click to enlarge) |  | 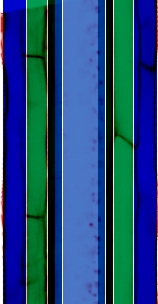 | Columella | NA | NA | Correlation
|
| 71 of 111 |  | Cortex | 51.23 | 0.0157 | 0.84821126812847 |
| AGI Number | Endodermis | 104.6 | 0.0337 |
| AT2G28810 | Epidermis | 54.3 | 0.014 |
| File Name | Difference Image
(click to enlarge) | Lateral Root Cap | NA | NA | TPE Score |
| 740.1.1.1strainormal |  | Pericycle | 250.73 | 0.039 | 0.9588588 |
| Line Number | QC | NA | NA |
| 740 | Stele | 313.03 | 0.1337 |
General Information | Image | Atlas Mapped | Tissue | Affy Data | GFP Data | Corelation/TPE Score
| | Row Number | Diagnostic Image
(click to enlarge) |  | 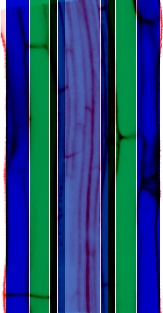 | Columella | NA | NA | Correlation
|
| 72 of 111 |  | Cortex | 51.23 | 0.0216 | 0.8488926789004 |
| AGI Number | Endodermis | 104.6 | 0.0343 |
| AT2G28810 | Epidermis | 54.3 | 0.0314 |
| File Name | Difference Image
(click to enlarge) | Lateral Root Cap | NA | NA | TPE Score |
| 742.1.3.1strainormal |  | Pericycle | 250.73 | 0.0421 | 0.8894543 |
| Line Number | QC | NA | NA |
| 742 | Stele | 313.03 | 0.1036 |
General Information | Image | Atlas Mapped | Tissue | Affy Data | GFP Data | Corelation/TPE Score
| | Row Number | Diagnostic Image
(click to enlarge) |  | 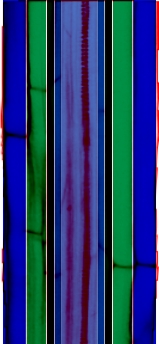 | Columella | NA | NA | Correlation
|
| 73 of 111 |  | Cortex | 51.23 | 0.0166 | 0.909174925451504 |
| AGI Number | Endodermis | 104.6 | 0.0209 |
| AT2G28810 | Epidermis | 54.3 | 0.0165 |
| File Name | Difference Image
(click to enlarge) | Lateral Root Cap | NA | NA | TPE Score |
| 740.1.4.2strainormal | 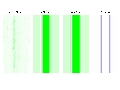 | Pericycle | 250.73 | 0.0405 | 0.9558642 |
| Line Number | QC | NA | NA |
| 740 | Stele | 313.03 | 0.0918 |
General Information | Image | Atlas Mapped | Tissue | Affy Data | GFP Data | Corelation/TPE Score
| | Row Number | Diagnostic Image
(click to enlarge) | 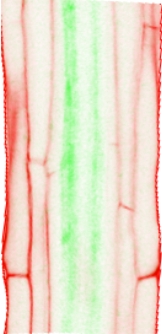 |  | Columella | NA | NA | Correlation
|
| 74 of 111 |  | Cortex | 51.23 | 0.0088 | 0.926107945726407 |
| AGI Number | Endodermis | 104.6 | 0.0116 |
| AT2G28810 | Epidermis | 54.3 | 0.009 |
| File Name | Difference Image
(click to enlarge) | Lateral Root Cap | 84.67 | 0.0081 | TPE Score |
| 740.1.4.4strainormal |  | Pericycle | 250.73 | 0.0549 | 0.9950559 |
| Line Number | QC | NA | NA |
| 740 | Stele | 313.03 | 0.1395 |
General Information | Image | Atlas Mapped | Tissue | Affy Data | GFP Data | Corelation/TPE Score
| | Row Number | Diagnostic Image
(click to enlarge) |  | 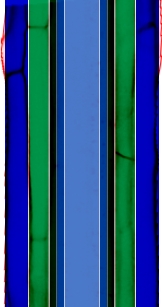 | Columella | NA | NA | Correlation
|
| 75 of 111 |  | Cortex | 51.23 | 0.0149 | 0.942123667470924 |
| AGI Number | Endodermis | 104.6 | 0.0179 |
| AT2G28810 | Epidermis | 54.3 | 0.0119 |
| File Name | Difference Image
(click to enlarge) | Lateral Root Cap | NA | NA | TPE Score |
| 740.1.5.2strainormal |  | Pericycle | 250.73 | 0.0531 | 0.9930034 |
| Line Number | QC | NA | NA |
| 740 | Stele | 313.03 | 0.1098 |
General Information | Image | Atlas Mapped | Tissue | Affy Data | GFP Data | Corelation/TPE Score
| | Row Number | Diagnostic Image
(click to enlarge) | 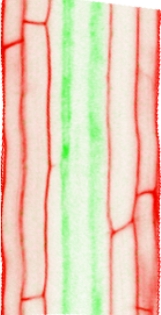 | 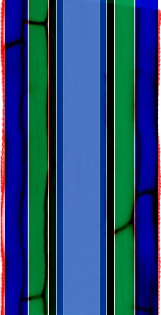 | Columella | NA | NA | Correlation
|
| 76 of 111 | 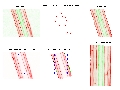 | Cortex | 51.23 | 0.0072 | 0.98149371446802 |
| AGI Number | Endodermis | 104.6 | 0.0136 |
| AT2G28810 | Epidermis | 54.3 | 0.0108 |
| File Name | Difference Image
(click to enlarge) | Lateral Root Cap | NA | NA | TPE Score |
| 740.1.2.3strainormal | 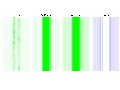 | Pericycle | 250.73 | 0.0927 | 0.9885004 |
| Line Number | QC | NA | NA |
| 740 | Stele | 313.03 | 0.1474 |
General Information | Image | Atlas Mapped | Tissue | Affy Data | GFP Data | Corelation/TPE Score
| | Row Number | Diagnostic Image
(click to enlarge) | 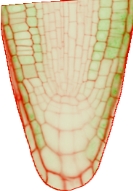 | 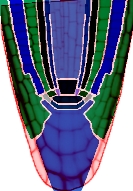 | Columella | 283.43 | 0.0603 | Correlation
|
| 77 of 111 | 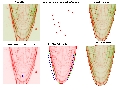 | Cortex | 725.47 | 0.1263 | 0.501609634804931 |
| AGI Number | Endodermis | 703.97 | 0.0716 |
| AT1G44830 | Epidermis | 2007.5 | 0.1329 |
| File Name | Difference Image
(click to enlarge) | Lateral Root Cap | 506.13 | 0.1554 | TPE Score |
| _1241.1.1.1strainormal |  | Pericycle | 86.47 | 0.0469 | 0.9588415 |
| Line Number | QC | 423.2 | 0.04 |
| 1241 | Stele | 718.9 | 0.0408 |
General Information | Image | Atlas Mapped | Tissue | Affy Data | GFP Data | Corelation/TPE Score
| | Row Number | Diagnostic Image
(click to enlarge) |  | 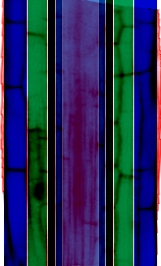 | Columella | NA | NA | Correlation
|
| 78 of 111 |  | Cortex | 725.47 | 0.0122 | 0.928185015292306 |
| AGI Number | Endodermis | 703.97 | 0 |
| AT1G44830 | Epidermis | 2007.5 | 0.201 |
| File Name | Difference Image
(click to enlarge) | Lateral Root Cap | NA | NA | TPE Score |
| 1241.2.2.3strainormal |  | Pericycle | 86.47 | 0 | 0.9670182 |
| Line Number | QC | NA | NA |
| 1241 | Stele | 718.9 | 0 |
General Information | Image | Atlas Mapped | Tissue | Affy Data | GFP Data | Corelation/TPE Score
| | Row Number | Diagnostic Image
(click to enlarge) | 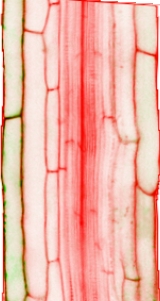 | 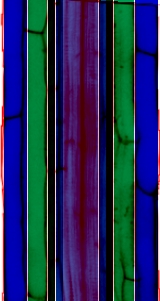 | Columella | NA | NA | Correlation
|
| 79 of 111 |  | Cortex | 725.47 | 0.0116 | 0.93898557324426 |
| AGI Number | Endodermis | 703.97 | 0.005 |
| AT1G44830 | Epidermis | 2007.5 | 0.0911 |
| File Name | Difference Image
(click to enlarge) | Lateral Root Cap | NA | NA | TPE Score |
| 1241.2.1.5strainormal |  | Pericycle | 86.47 | 0 | 0.990866 |
| Line Number | QC | NA | NA |
| 1241 | Stele | 718.9 | 0 |
General Information | Image | Atlas Mapped | Tissue | Affy Data | GFP Data | Corelation/TPE Score
| | Row Number | Diagnostic Image
(click to enlarge) |  | 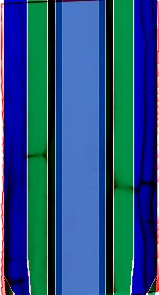 | Columella | NA | NA | Correlation
|
| 80 of 111 | 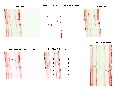 | Cortex | 16.4 | 0.0205 | 0.817596811828446 |
| AGI Number | Endodermis | 49.8 | 0.0356 |
| AT5G12870 | Epidermis | 36.97 | 0.0282 |
| File Name | Difference Image
(click to enlarge) | Lateral Root Cap | 50.57 | 0.0391 | TPE Score |
| 480-1-5strainormal |  | Pericycle | 25.53 | 0.0405 | 0.9824905 |
| Line Number | QC | NA | NA |
| 480 | Stele | 276.6 | 0.0553 |
General Information | Image | Atlas Mapped | Tissue | Affy Data | GFP Data | Corelation/TPE Score
| | Row Number | Diagnostic Image
(click to enlarge) |  |  | Columella | NA | NA | Correlation
|
| 81 of 111 | 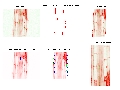 | Cortex | 16.4 | 0.024 | 0.924379110486437 |
| AGI Number | Endodermis | 49.8 | 0.023 |
| AT5G12870 | Epidermis | 36.97 | 0.035 |
| File Name | Difference Image
(click to enlarge) | Lateral Root Cap | NA | NA | TPE Score |
| 481-1-3strainormal | 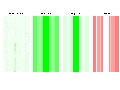 | Pericycle | 25.53 | 0.03 | 0.9152838 |
| Line Number | QC | NA | NA |
| 481 | Stele | 276.6 | 0.0557 |
General Information | Image | Atlas Mapped | Tissue | Affy Data | GFP Data | Corelation/TPE Score
| | Row Number | Diagnostic Image
(click to enlarge) | 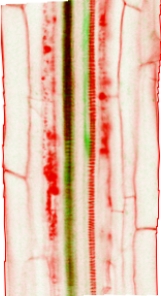 | 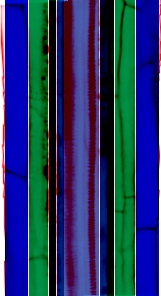 | Columella | NA | NA | Correlation
|
| 82 of 111 |  | Cortex | 16.4 | 0.0061 | 0.969831318839283 |
| AGI Number | Endodermis | 49.8 | 0.0148 |
| AT5G12870 | Epidermis | 36.97 | 0.0068 |
| File Name | Difference Image
(click to enlarge) | Lateral Root Cap | NA | NA | TPE Score |
| 480-1-4strainormal |  | Pericycle | 25.53 | 0.0468 | 0.9539401 |
| Line Number | QC | NA | NA |
| 480 | Stele | 276.6 | 0.1986 |
General Information | Image | Atlas Mapped | Tissue | Affy Data | GFP Data | Corelation/TPE Score
| | Row Number | Diagnostic Image
(click to enlarge) |  |  | Columella | NA | NA | Correlation
|
| 83 of 111 |  | Cortex | 16.4 | 0 | 0.994816914795562 |
| AGI Number | Endodermis | 49.8 | 0.0015 |
| AT5G12870 | Epidermis | 36.97 | 0.0042 |
| File Name | Difference Image
(click to enlarge) | Lateral Root Cap | NA | NA | TPE Score |
| _479_1_11strainormal |  | Pericycle | 25.53 | 0.0015 | 0.9906892 |
| Line Number | QC | NA | NA |
| 479 | Stele | 276.6 | 0.0465 |
General Information | Image | Atlas Mapped | Tissue | Affy Data | GFP Data | Corelation/TPE Score
| | Row Number | Diagnostic Image
(click to enlarge) |  |  | Columella | 89.5 | 0 | Correlation
|
| 84 of 111 |  | Cortex | 256 | 0.0039 | 0.76084093720672 |
| AGI Number | Endodermis | 269.03 | 0.0372 |
| AT2G46410 | Epidermis | 679.07 | 0.2442 |
| File Name | Difference Image
(click to enlarge) | Lateral Root Cap | 121.17 | 0.1248 | TPE Score |
| 1260.1.6.4strainormal |  | Pericycle | 242.23 | 0.0838 | 0.9328266 |
| Line Number | QC | 182 | 0.0407 |
| 1260 | Stele | 319.27 | 0.051 |
General Information | Image | Atlas Mapped | Tissue | Affy Data | GFP Data | Corelation/TPE Score
| | Row Number | Diagnostic Image
(click to enlarge) |  |  | Columella | 89.5 | 0.006 | Correlation
|
| 85 of 111 |  | Cortex | 256 | 0.0139 | 0.77317362884525 |
| AGI Number | Endodermis | 269.03 | 0.0431 |
| AT2G46410 | Epidermis | 679.07 | 0.1473 |
| File Name | Difference Image
(click to enlarge) | Lateral Root Cap | 121.17 | 0.0732 | TPE Score |
| 1260.1.5.1strainormal |  | Pericycle | 242.23 | 0.0799 | 0.9083522 |
| Line Number | QC | 182 | 0.0529 |
| 1260 | Stele | 319.27 | 0.0485 |
General Information | Image | Atlas Mapped | Tissue | Affy Data | GFP Data | Corelation/TPE Score
| | Row Number | Diagnostic Image
(click to enlarge) |  |  | Columella | 89.5 | 0.0152 | Correlation
|
| 86 of 111 |  | Cortex | 256 | 0.0451 | 0.894145292347735 |
| AGI Number | Endodermis | 269.03 | 0.025 |
| AT2G46410 | Epidermis | 679.07 | 0.0927 |
| File Name | Difference Image
(click to enlarge) | Lateral Root Cap | 121.17 | 0.0317 | TPE Score |
| 1260.1.2.2strainormal |  | Pericycle | 242.23 | 0.0303 | 0.9101782 |
| Line Number | QC | 182 | 0.039 |
| 1260 | Stele | 319.27 | 0.0679 |
General Information | Image | Atlas Mapped | Tissue | Affy Data | GFP Data | Corelation/TPE Score
| | Row Number | Diagnostic Image
(click to enlarge) |  |  | Columella | 89.5 | 0 | Correlation
|
| 87 of 111 |  | Cortex | 256 | 0.0393 | 0.91307887423952 |
| AGI Number | Endodermis | 269.03 | 0.0075 |
| AT2G46410 | Epidermis | 679.07 | 0.2632 |
| File Name | Difference Image
(click to enlarge) | Lateral Root Cap | 121.17 | 0.0523 | TPE Score |
| 1260.1.3.1strainormal |  | Pericycle | 242.23 | 0.036 | 0.9985913 |
| Line Number | QC | 182 | 0.0145 |
| 1260 | Stele | 319.27 | 0.0472 |
General Information | Image | Atlas Mapped | Tissue | Affy Data | GFP Data | Corelation/TPE Score
| | Row Number | Diagnostic Image
(click to enlarge) |  |  | Columella | 89.5 | 0.0029 | Correlation
|
| 88 of 111 |  | Cortex | 256 | 0.0092 | 0.92083437146286 |
| AGI Number | Endodermis | 269.03 | 0.0155 |
| AT2G46410 | Epidermis | 679.07 | 0.1537 |
| File Name | Difference Image
(click to enlarge) | Lateral Root Cap | 121.17 | 0.0287 | TPE Score |
| 1260.1.1.1strainormal |  | Pericycle | 242.23 | 0.0376 | 0.9317668 |
| Line Number | QC | 182 | 0.0166 |
| 1260 | Stele | 319.27 | 0.0335 |
General Information | Image | Atlas Mapped | Tissue | Affy Data | GFP Data | Corelation/TPE Score
| | Row Number | Diagnostic Image
(click to enlarge) |  |  | Columella | 89.5 | 0.0069 | Correlation
|
| 89 of 111 |  | Cortex | 256 | 0.0534 | 0.95635423961176 |
| AGI Number | Endodermis | 269.03 | 0.0197 |
| AT2G46410 | Epidermis | 679.07 | 0.1792 |
| File Name | Difference Image
(click to enlarge) | Lateral Root Cap | 121.17 | 0.028 | TPE Score |
| 1260.1.4.1strainormal | 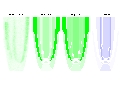 | Pericycle | 242.23 | 0.0328 | 0.9531434 |
| Line Number | QC | 182 | 0.0255 |
| 1260 | Stele | 319.27 | 0.0543 |
General Information | Image | Atlas Mapped | Tissue | Affy Data | GFP Data | Corelation/TPE Score
| | Row Number | Diagnostic Image
(click to enlarge) | 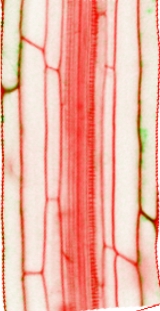 | 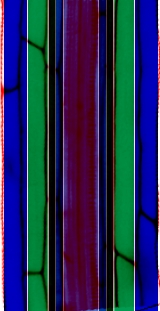 | Columella | NA | NA | Correlation
|
| 90 of 111 | 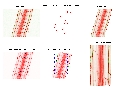 | Cortex | 256 | 0.0072 | 0.973943072748942 |
| AGI Number | Endodermis | 269.03 | 0.0076 |
| AT2G46410 | Epidermis | 679.07 | 0.0703 |
| File Name | Difference Image
(click to enlarge) | Lateral Root Cap | NA | NA | TPE Score |
| 1260.1.6.1strainormal |  | Pericycle | 242.23 | 0.0185 | 0.9485157 |
| Line Number | QC | NA | NA |
| 1260 | Stele | 319.27 | 0.0235 |
General Information | Image | Atlas Mapped | Tissue | Affy Data | GFP Data | Corelation/TPE Score
| | Row Number | Diagnostic Image
(click to enlarge) |  |  | Columella | NA | NA | Correlation
|
| 91 of 111 |  | Cortex | 256 | 0.0229 | 0.98219784783632 |
| AGI Number | Endodermis | 269.03 | 0.0023 |
| AT2G46410 | Epidermis | 679.07 | 0.1768 |
| File Name | Difference Image
(click to enlarge) | Lateral Root Cap | NA | NA | TPE Score |
| 1260.1.3.3strainormal | 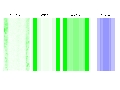 | Pericycle | 242.23 | 0.0057 | 0.9695458 |
| Line Number | QC | NA | NA |
| 1260 | Stele | 319.27 | 0.0113 |
General Information | Image | Atlas Mapped | Tissue | Affy Data | GFP Data | Corelation/TPE Score
| | Row Number | Diagnostic Image
(click to enlarge) | 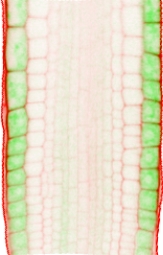 | 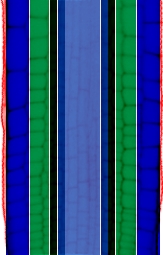 | Columella | NA | NA | Correlation
|
| 92 of 111 |  | Cortex | 256 | 0.0012 | 0.983331441785546 |
| AGI Number | Endodermis | 269.03 | 0.0032 |
| AT2G46410 | Epidermis | 679.07 | 0.1901 |
| File Name | Difference Image
(click to enlarge) | Lateral Root Cap | NA | NA | TPE Score |
| 1260.1.1.2strainormal |  | Pericycle | 242.23 | 0.0144 | 0.9181497 |
| Line Number | QC | NA | NA |
| 1260 | Stele | 319.27 | 0.0065 |
General Information | Image | Atlas Mapped | Tissue | Affy Data | GFP Data | Corelation/TPE Score
| | Row Number | Diagnostic Image
(click to enlarge) |  |  | Columella | NA | NA | Correlation
|
| 93 of 111 |  | Cortex | 256 | 0.0184 | 0.98378550775546 |
| AGI Number | Endodermis | 269.03 | 0.0105 |
| AT2G46410 | Epidermis | 679.07 | 0.061 |
| File Name | Difference Image
(click to enlarge) | Lateral Root Cap | NA | NA | TPE Score |
| 1260.1.2.1strainormal |  | Pericycle | 242.23 | 0.0099 | 0.9541541 |
| Line Number | QC | NA | NA |
| 1260 | Stele | 319.27 | 0.0163 |
General Information | Image | Atlas Mapped | Tissue | Affy Data | GFP Data | Corelation/TPE Score
| | Row Number | Diagnostic Image
(click to enlarge) |  |  | Columella | NA | NA | Correlation
|
| 94 of 111 |  | Cortex | 256 | 0.0056 | 0.987151302838024 |
| AGI Number | Endodermis | 269.03 | 0.0043 |
| AT2G46410 | Epidermis | 679.07 | 0.2088 |
| File Name | Difference Image
(click to enlarge) | Lateral Root Cap | NA | NA | TPE Score |
| 1260.1.6.2strainormal |  | Pericycle | 242.23 | 0.0122 | 0.9449857 |
| Line Number | QC | NA | NA |
| 1260 | Stele | 319.27 | 0.01 |
General Information | Image | Atlas Mapped | Tissue | Affy Data | GFP Data | Corelation/TPE Score
| | Row Number | Diagnostic Image
(click to enlarge) |  |  | Columella | NA | NA | Correlation
|
| 95 of 111 |  | Cortex | 17.43 | 0.0555 | 0.965122651915887 |
| AGI Number | Endodermis | 21.33 | 0.0325 |
| AT1G71930 | Epidermis | 18.13 | 0.0297 |
| File Name | Difference Image
(click to enlarge) | Lateral Root Cap | NA | NA | TPE Score |
| 595.2.1-4strainormal |  | Pericycle | 25.47 | 0.0549 | 0.9549739 |
| Line Number | QC | NA | NA |
| 595 | Stele | 240.5 | 0.14 |
General Information | Image | Atlas Mapped | Tissue | Affy Data | GFP Data | Corelation/TPE Score
| | Row Number | Diagnostic Image
(click to enlarge) |  |  | Columella | NA | NA | Correlation
|
| 96 of 111 |  | Cortex | 17.43 | 0.0314 | 0.965177715045177 |
| AGI Number | Endodermis | 21.33 | 0.0463 |
| AT1G71930 | Epidermis | 18.13 | 0.0363 |
| File Name | Difference Image
(click to enlarge) | Lateral Root Cap | NA | NA | TPE Score |
| 595.2.2-2strainormal |  | Pericycle | 25.47 | 0.0642 | 0.9566657 |
| Line Number | QC | NA | NA |
| 595 | Stele | 240.5 | 0.1363 |
General Information | Image | Atlas Mapped | Tissue | Affy Data | GFP Data | Corelation/TPE Score
| | Row Number | Diagnostic Image
(click to enlarge) |  |  | Columella | NA | NA | Correlation
|
| 97 of 111 |  | Cortex | 17.43 | 0.0227 | 0.9971748124223 |
| AGI Number | Endodermis | 21.33 | 0.022 |
| AT1G71930 | Epidermis | 18.13 | 0.023 |
| File Name | Difference Image
(click to enlarge) | Lateral Root Cap | NA | NA | TPE Score |
| 595_2_23strainormal |  | Pericycle | 25.47 | 0.0224 | 0.9661445 |
| Line Number | QC | NA | NA |
| 595 | Stele | 240.5 | 0.0385 |
General Information | Image | Atlas Mapped | Tissue | Affy Data | GFP Data | Corelation/TPE Score
| | Row Number | Diagnostic Image
(click to enlarge) |  |  | Columella | 18.5 | 0.005 | Correlation
|
| 98 of 111 |  | Cortex | 19.43 | 0.0035 | 0.581170129417799 |
| AGI Number | Endodermis | 40.57 | 0.0247 |
| AT2G18380 | Epidermis | 34.5 | 0.0031 |
| File Name | Difference Image
(click to enlarge) | Lateral Root Cap | 66.73 | 0.0047 | TPE Score |
| _697_2_11strainormal |  | Pericycle | 42.2 | 0.1661 | 0.9360998 |
| Line Number | QC | 33.85 | 0.0029 |
| 697 | Stele | 161.5 | 0.1387 |
General Information | Image | Atlas Mapped | Tissue | Affy Data | GFP Data | Corelation/TPE Score
| | Row Number | Diagnostic Image
(click to enlarge) | 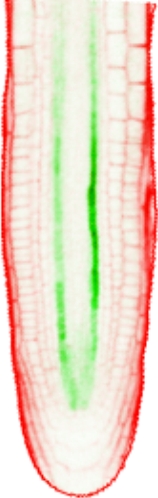 | 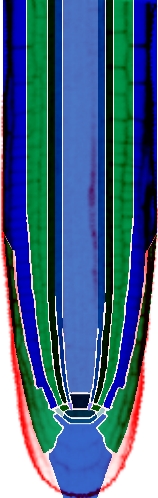 | Columella | 18.5 | 0 | Correlation
|
| 99 of 111 |  | Cortex | 19.43 | 0.0047 | 0.670351423227142 |
| AGI Number | Endodermis | 40.57 | 0.0257 |
| AT2G18380 | Epidermis | 34.5 | 0.0028 |
| File Name | Difference Image
(click to enlarge) | Lateral Root Cap | 66.73 | 0.0014 | TPE Score |
| _699_2_15strainormal |  | Pericycle | 42.2 | 0.1373 | 0.7849703 |
| Line Number | QC | 33.85 | 0.0059 |
| 699 | Stele | 161.5 | 0.1424 |
General Information | Image | Atlas Mapped | Tissue | Affy Data | GFP Data | Corelation/TPE Score
| | Row Number | Diagnostic Image
(click to enlarge) |  |  | Columella | 18.5 | 0.0125 | Correlation
|
| 100 of 111 |  | Cortex | 19.43 | 0.0067 | 0.93956930796639 |
| AGI Number | Endodermis | 40.57 | 0.0055 |
| AT2G18380 | Epidermis | 34.5 | 0.0067 |
| File Name | Difference Image
(click to enlarge) | Lateral Root Cap | 66.73 | 0.011 | TPE Score |
| 697.1.3.1strainormal |  | Pericycle | 42.2 | 0.0053 | 0.8726162 |
| Line Number | QC | 33.85 | 0.0238 |
| 697 | Stele | 161.5 | 0.1753 |
General Information | Image | Atlas Mapped | Tissue | Affy Data | GFP Data | Corelation/TPE Score
| | Row Number | Diagnostic Image
(click to enlarge) |  |  | Columella | NA | NA | Correlation
|
| 101 of 111 |  | Cortex | 19.43 | 0.0139 | 0.994437938460408 |
| AGI Number | Endodermis | 40.57 | 0.0174 |
| AT2G18380 | Epidermis | 34.5 | 0.0152 |
| File Name | Difference Image
(click to enlarge) | Lateral Root Cap | NA | NA | TPE Score |
| 697.1.3.7strainormal | 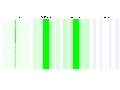 | Pericycle | 42.2 | 0.0239 | 0.9432576 |
| Line Number | QC | NA | NA |
| 697 | Stele | 161.5 | 0.1038 |
General Information | Image | Atlas Mapped | Tissue | Affy Data | GFP Data | Corelation/TPE Score
| | Row Number | Diagnostic Image
(click to enlarge) | 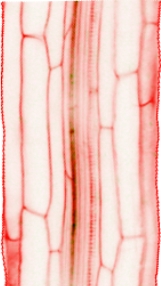 | 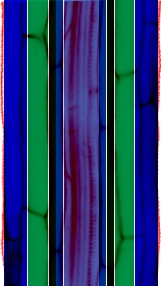 | Columella | NA | NA | Correlation
|
| 102 of 111 | 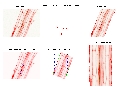 | Cortex | 19.43 | 0.0086 | 0.995990428270584 |
| AGI Number | Endodermis | 40.57 | 0.0109 |
| AT2G18380 | Epidermis | 34.5 | 0.0126 |
| File Name | Difference Image
(click to enlarge) | Lateral Root Cap | NA | NA | TPE Score |
| 697.1.3.5strainormal | 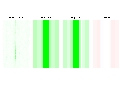 | Pericycle | 42.2 | 0.0135 | 0.8819659 |
| Line Number | QC | NA | NA |
| 697 | Stele | 161.5 | 0.0479 |
General Information | Image | Atlas Mapped | Tissue | Affy Data | GFP Data | Corelation/TPE Score
| | Row Number | Diagnostic Image
(click to enlarge) | 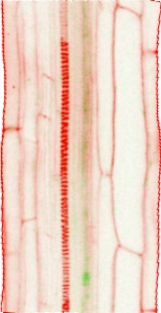 | 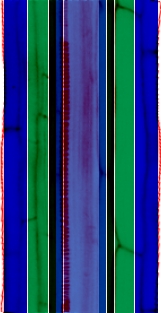 | Columella | NA | NA | Correlation
|
| 103 of 111 |  | Cortex | 19.43 | 0.0189 | 0.996300026571095 |
| AGI Number | Endodermis | 40.57 | 0.0253 |
| AT2G18380 | Epidermis | 34.5 | 0.0225 |
| File Name | Difference Image
(click to enlarge) | Lateral Root Cap | NA | NA | TPE Score |
| 697.1.1.9strainormal |  | Pericycle | 42.2 | 0.0294 | 0.8913655 |
| Line Number | QC | NA | NA |
| 697 | Stele | 161.5 | 0.066 |
General Information | Image | Atlas Mapped | Tissue | Affy Data | GFP Data | Corelation/TPE Score
| | Row Number | Diagnostic Image
(click to enlarge) |  |  | Columella | 26.57 | 0.0594 | Correlation
|
| 104 of 111 |  | Cortex | 41.9 | 0.0258 | 0.940962473442133 |
| AGI Number | Endodermis | 20.03 | 0.0332 |
| AT5G20240 | Epidermis | 45.27 | 0.0312 |
| File Name | Difference Image
(click to enlarge) | Lateral Root Cap | 29.33 | 0.0576 | TPE Score |
| 982.1.1strainormal |  | Pericycle | 19.87 | 0.0219 | 0.9661298 |
| Line Number | QC | 884.15 | 0.1593 |
| 982 | Stele | 24.4 | 0.0163 |
General Information | Image | Atlas Mapped | Tissue | Affy Data | GFP Data | Corelation/TPE Score
| | Row Number | Diagnostic Image
(click to enlarge) | 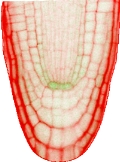 | 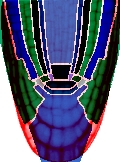 | Columella | 26.57 | 0.048 | Correlation
|
| 105 of 111 | 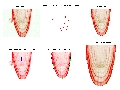 | Cortex | 41.9 | 0.0397 | 0.97651487721964 |
| AGI Number | Endodermis | 20.03 | 0.0511 |
| AT5G20240 | Epidermis | 45.27 | 0.0412 |
| File Name | Difference Image
(click to enlarge) | Lateral Root Cap | 29.33 | 0.0585 | TPE Score |
| 982.1.2.1strainormal | 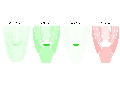 | Pericycle | 19.87 | 0.0392 | 0.8831295 |
| Line Number | QC | 884.15 | 0.1876 |
| 982 | Stele | 24.4 | 0.0203 |
General Information | Image | Atlas Mapped | Tissue | Affy Data | GFP Data | Corelation/TPE Score
| | Row Number | Diagnostic Image
(click to enlarge) | 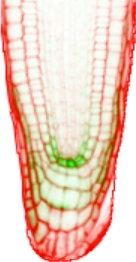 | 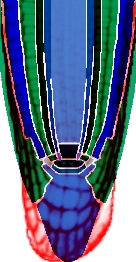 | Columella | 26.57 | 0.0618 | Correlation
|
| 106 of 111 |  | Cortex | 41.9 | 0.017 | 0.982853082465893 |
| AGI Number | Endodermis | 20.03 | 0.0314 |
| AT5G20240 | Epidermis | 45.27 | 0.0466 |
| File Name | Difference Image
(click to enlarge) | Lateral Root Cap | 29.33 | 0.0989 | TPE Score |
| _983_1_11strainormal |  | Pericycle | 19.87 | 0.0193 | 0.8609631 |
| Line Number | QC | 884.15 | 0.4934 |
| 983 | Stele | 24.4 | 0.0029 |
General Information | Image | Atlas Mapped | Tissue | Affy Data | GFP Data | Corelation/TPE Score
| | Row Number | Diagnostic Image
(click to enlarge) | 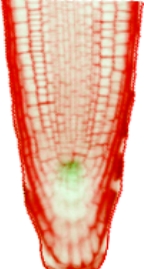 | 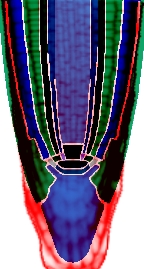 | Columella | 60.37 | 0.0625 | Correlation
|
| 107 of 111 |  | Cortex | 15.17 | 0.0449 | 0.984579680849737 |
| AGI Number | Endodermis | 29.77 | 0.0456 |
| AT3G20880 | Epidermis | 30.1 | 0.0604 |
| File Name | Difference Image
(click to enlarge) | Lateral Root Cap | 49.97 | 0.0802 | TPE Score |
| _1040_1_11strainormal |  | Pericycle | 24.67 | 0.0429 | 0.8434883 |
| Line Number | QC | 1027.55 | 0.2279 |
| 1040 | Stele | 20.2 | 0.0446 |
General Information | Image | Atlas Mapped | Tissue | Affy Data | GFP Data | Corelation/TPE Score
| | Row Number | Diagnostic Image
(click to enlarge) | 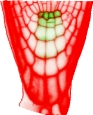 | 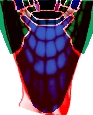 | Columella | 60.37 | 0.0274 | Correlation
|
| 108 of 111 | 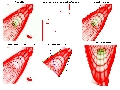 | Cortex | 15.17 | 0 | 0.9985311235389 |
| AGI Number | Endodermis | 29.77 | 0 |
| AT3G20880 | Epidermis | 30.1 | 0 |
| File Name | Difference Image
(click to enlarge) | Lateral Root Cap | 49.97 | 0.0018 | TPE Score |
| _1037_1_21strainormal | 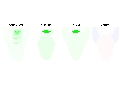 | Pericycle | 24.67 | 0 | 0.9956541 |
| Line Number | QC | 1027.55 | 0.3408 |
| 1037 | Stele | NA | NA |
General Information | Image | Atlas Mapped | Tissue | Affy Data | GFP Data | Corelation/TPE Score
| | Row Number | Diagnostic Image
(click to enlarge) | 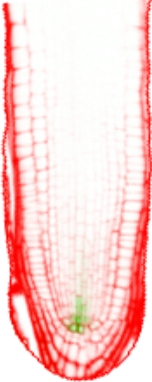 | 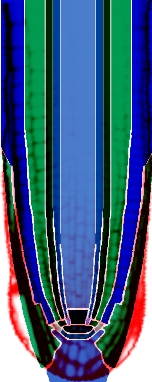 | Columella | 41.2 | 0.0072 | Correlation
|
| 109 of 111 |  | Cortex | 45.67 | 0.0022 | 0.998807061011099 |
| AGI Number | Endodermis | 70.67 | 0.002 |
| AT5G17800 | Epidermis | 44.9 | 0.003 |
| File Name | Difference Image
(click to enlarge) | Lateral Root Cap | 53.07 | 0.0084 | TPE Score |
| _1234.6_11strainormal |  | Pericycle | 49.97 | 0.0021 | 0.9667021 |
| Line Number | QC | 1790.7 | 0.185 |
| 1234 | Stele | 118.27 | 0.0075 |
General Information | Image | Atlas Mapped | Tissue | Affy Data | GFP Data | Corelation/TPE Score
| | Row Number | Diagnostic Image
(click to enlarge) | 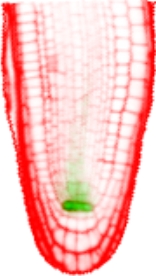 | 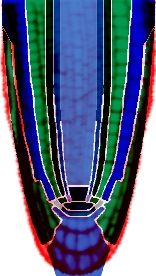 | Columella | 41.2 | 0.0011 | Correlation
|
| 110 of 111 |  | Cortex | 45.67 | 0.0046 | 0.999743860365033 |
| AGI Number | Endodermis | 70.67 | 0.0086 |
| AT5G17800 | Epidermis | 44.9 | 0 |
| File Name | Difference Image
(click to enlarge) | Lateral Root Cap | 53.07 | 0 | TPE Score |
| _1234.4_11strainormal |  | Pericycle | 49.97 | 0.014 | 0.926836 |
| Line Number | QC | 1790.7 | 0.6115 |
| 1234 | Stele | 118.27 | 0.0231 |
General Information | Image | Atlas Mapped | Tissue | Affy Data | GFP Data | Corelation/TPE Score
| | Row Number | Diagnostic Image
(click to enlarge) | 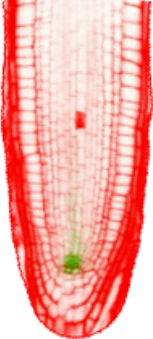 | 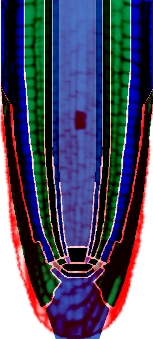 | Columella | 41.2 | 0.0123 | Correlation
|
| 111 of 111 | 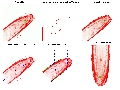 | Cortex | 45.67 | 0.0148 | 0.999825626248604 |
| AGI Number | Endodermis | 70.67 | 0.0136 |
| AT5G17800 | Epidermis | 44.9 | 0.0133 |
| File Name | Difference Image
(click to enlarge) | Lateral Root Cap | 53.07 | 0.0159 | TPE Score |
| _1234.6_21strainormal | 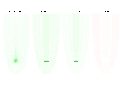 | Pericycle | 49.97 | 0.0123 | 0.6723731 |
| Line Number | QC | 1790.7 | 0.2916 |
| 1234 | Stele | 118.27 | 0.0224 |